
Separating access to the OpenShift Projects and Kubernetes Namespaces using Splunk Roles
February 11, 2019We have found from our customers, that is a very common request to let application developers see the data only from the OpenShift Projects and Kubernetes Namespaces, that they are working on.
In this blog post we will show you how you can do that with Splunk roles. We will use OpenShift as an example, but you can follow the same guidance to perform the same on Kubernetes namespaces.
There are two ways how you can restrict access to the data using Splunk roles. One is by indexes, and the second one is by applying restrictions on search terms.
Restrictions with Indexes
Configuring Splunk
We will use a Project named sock-shop as an example. To be able to restrict access to the logs and metrics that are
generated by the Pods running inside of this Project at first we need to create a new index in Splunk.
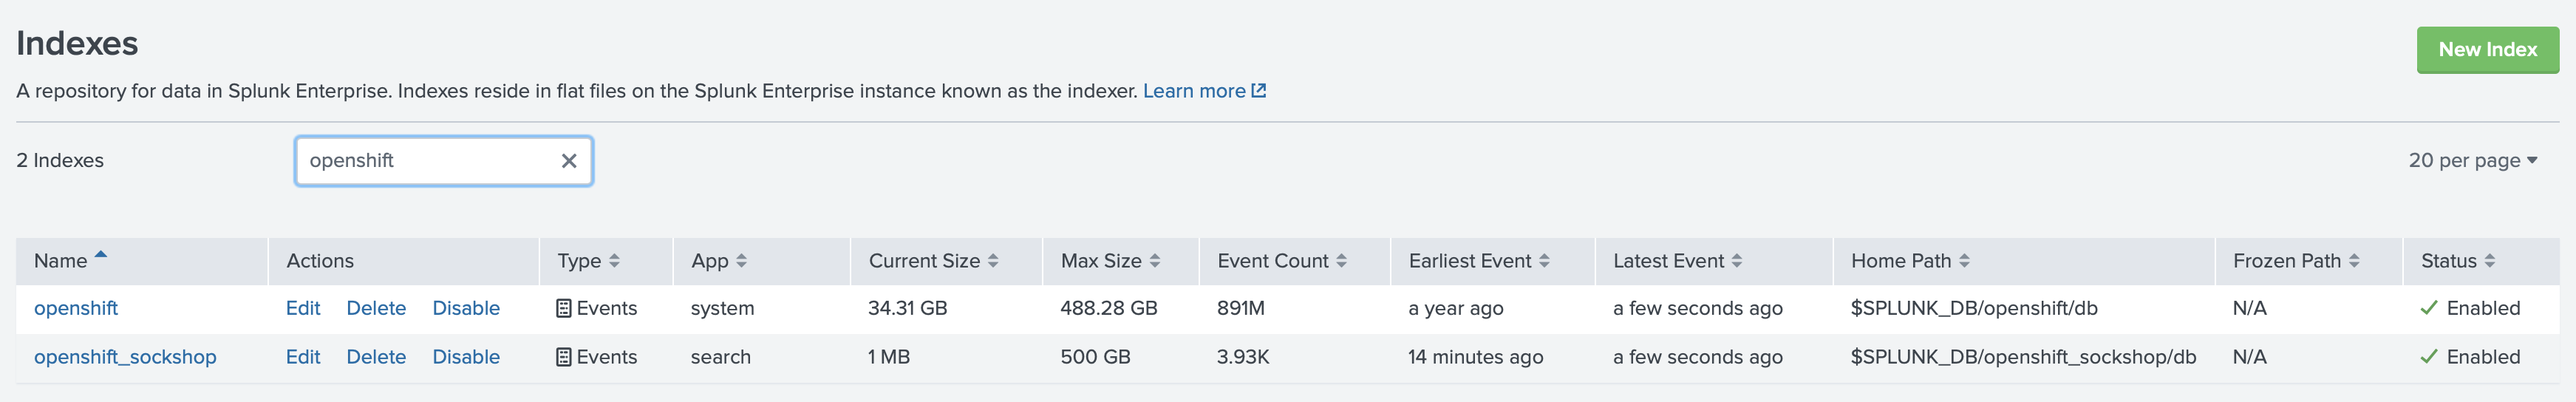
As you can see, currently we have two indexes openshift and openshift_sockshop. First one is a default index, where
we redirect all data, and the second index will be used for forwarding only data from the sock-shop Project. We recommend
prefixing all the indexes that are used for storing data forwarded from OpenShift similarly, like openshift_ or os_.
In that way it will be much easier to modify the macros and saved searches to adjust which indexes you will be able to see.
We will show you later on example.
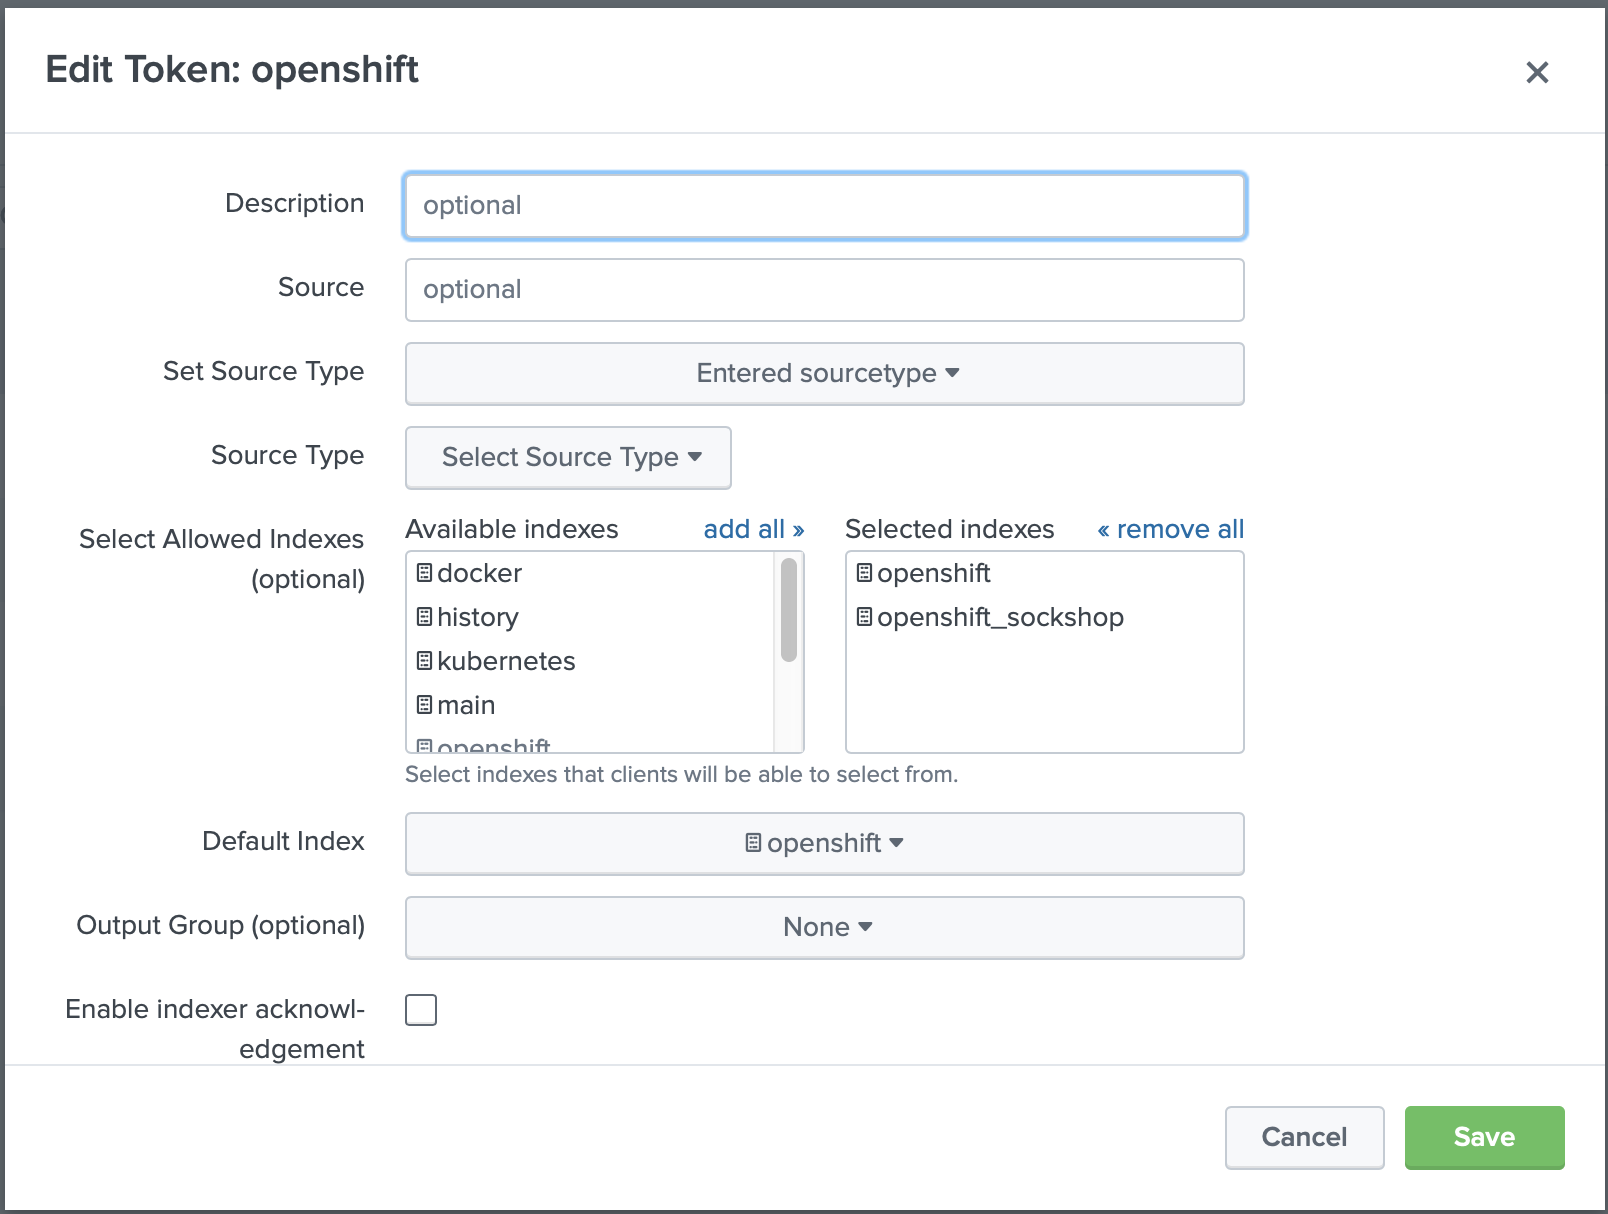
The second step, we need to allow the HTTP Event Collector Token to write to a newly created index. Using the web interface ( if you are using Splunk single instance, Splunk Cloud or a Splunk Deployment Server) you can modify and add this index to the list
If you have a distributed Splunk HTTP Event Collector and you don't use Splunk Deployment Server, you will need to
modify the inputs.conf and add index openshift_sockshop to the list of indexes.
[http://openshift]
disabled = 0
index = openshift
indexes = openshift,openshift_sockshop
token = 00000000-0000-0000-0000-000000000003
Splunk is ready now to accept data to the openshift_sockshop index.
Configuring OpenShift
To tell Collectord to forward all the logs and metrics from the sock-shop namespace, we need to annotate it with
oc annotate namespace sock-shop collectord.io/index=openshift_sockshop
In case of Kubernetes use
kubectl annotate namespace sock-shop collectord.io/index=openshift_sockshop
If this is not a new Project, and you already have Pods running in it, you have several options: wait till Collectord reloads the metadata and acknowledge the new annotations; recreate all Pods in this Project; or restart Collectord itself with
oc delete pods --all --namespace collectorforopenshift
In case of Kubernetes use
kubectl delete pods --all --namespace collectorforkubernetes
Making data visible
You can find that after doing this change you might not see the data in Splunk for this project. The reason for that, because our search macros are looking only in indexes searched by default. You have two options: make the newly created index to be searchable by default, or modify the search macros. See Monitoring OpenShift. Configuring Splunk Indexes for details.
For Kubernetes Monitoring Kubernetes. Configuring Splunk Indexes
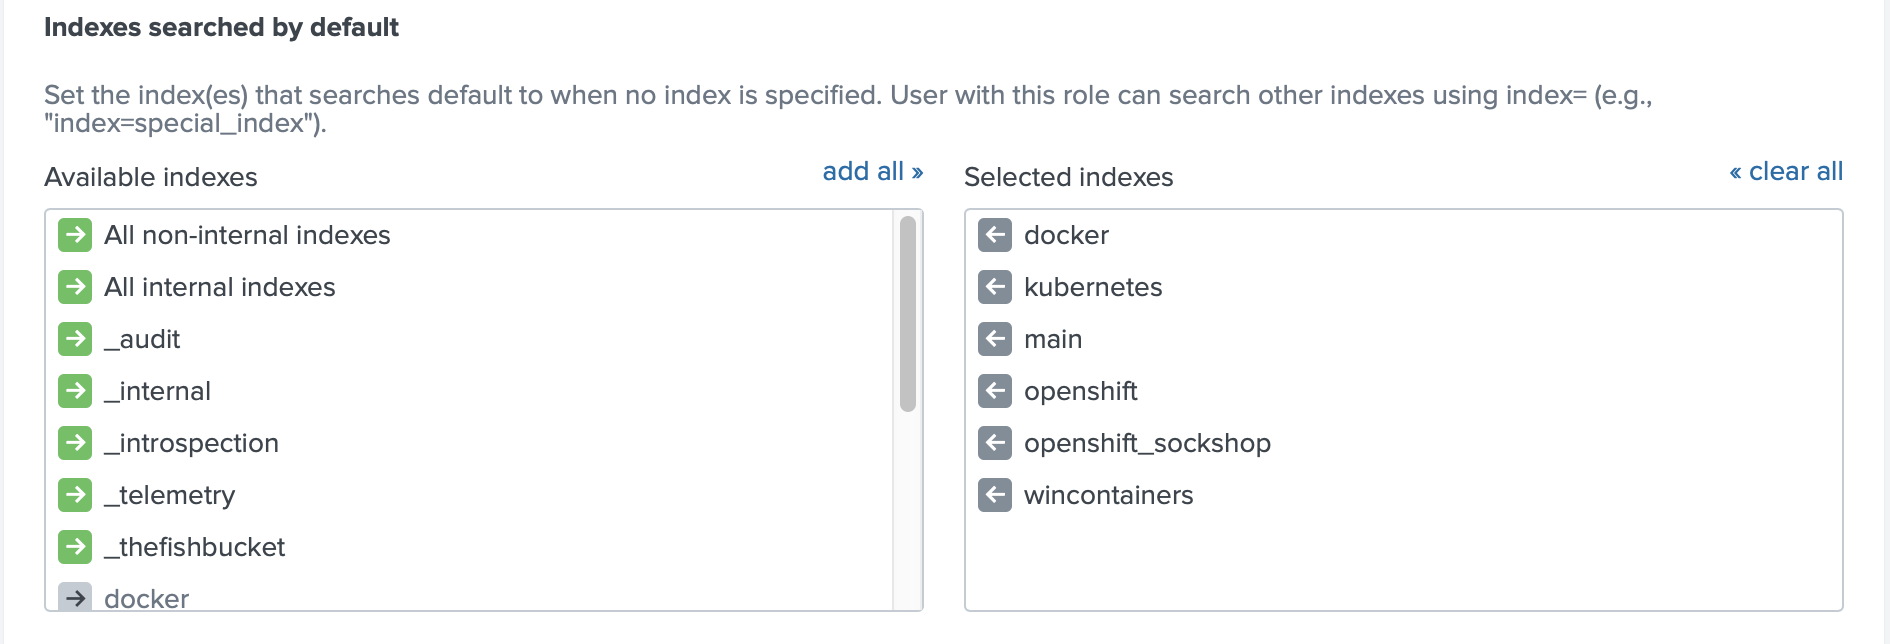
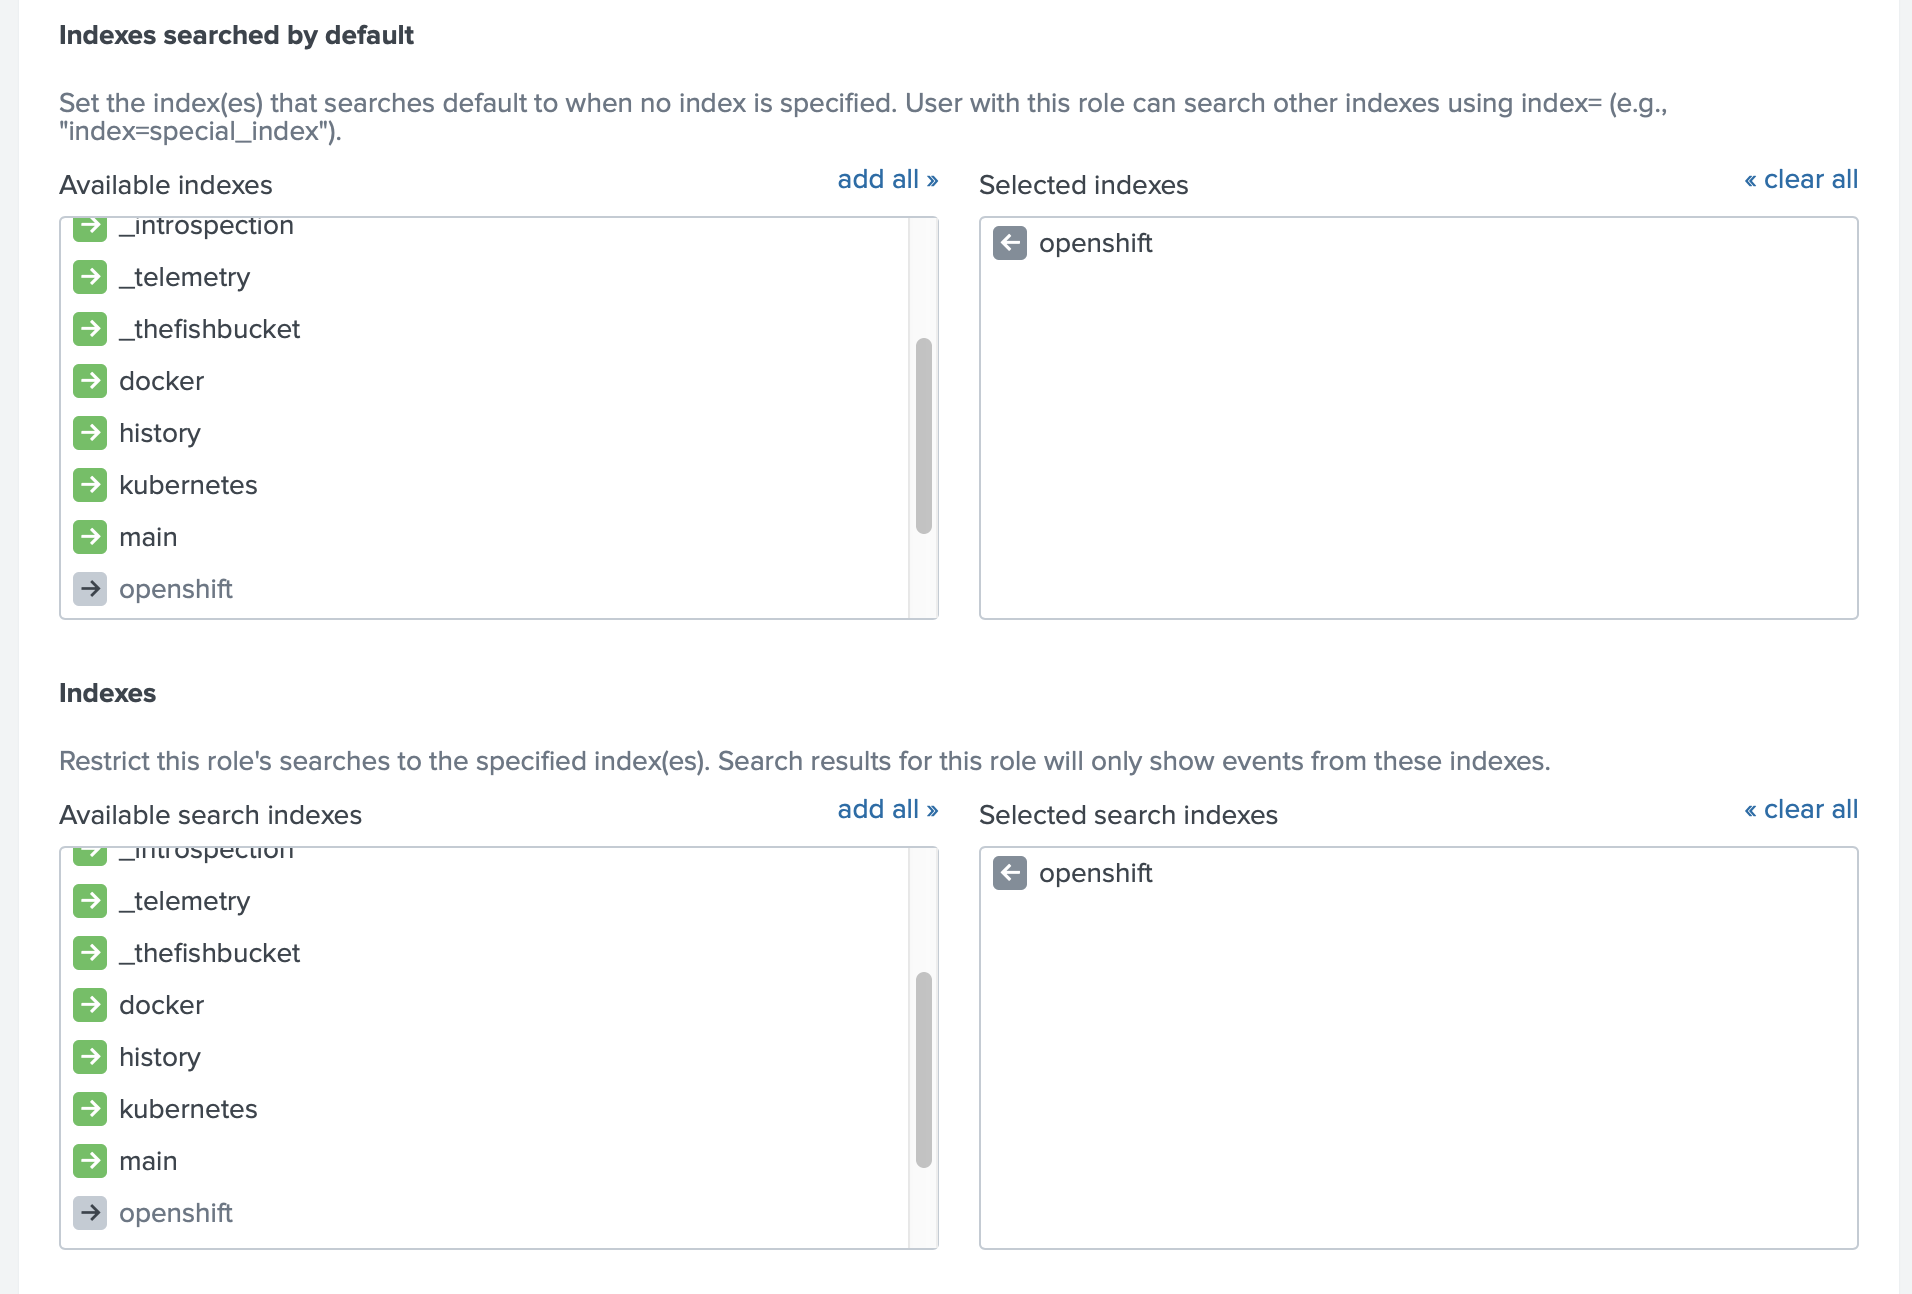
To make the data visible for a current role you can add this index to the list of the indexes searched by default
As an alternative you can make these indexes visible in the application by modifying the search macros (in Advanced Search).
This is where the naming pattern for indexes can be handy, you can prefix all the base macros (macros that used by all the searches
and other macros) with index=openshift* as in the example below. You can modify the macros using the Splunk Web interface
or by creating the macros.conf file in $SPLUNK_ETC/apps/monitoringopenshift/local/macros.conf
If you are using Version 5.9 or above you just need to modify the base macro
macro_openshift_baseasdefinition = (index=openshift*), and that macro will be applied to all other macros as well.
[macro_openshift_events]
definition = (index=openshift* sourcetype=openshift_events NOT "\"type\":\"DELETED\"")

[macro_openshift_host_logs]
definition = (index=openshift* sourcetype=openshift_host_logs)

[macro_openshift_logs]
definition = (index=openshift* sourcetype=openshift_logs)

[macro_openshift_mount_stats]
definition = (index=openshift* sourcetype=openshift_mount_stats)

[macro_openshift_net_socket_table]
definition = (index=openshift* sourcetype=openshift_net_socket_table)

[macro_openshift_net_stats]
definition = (index=openshift* sourcetype=openshift_net_stats)

[macro_openshift_proc_stats]
definition = (index=openshift* sourcetype=openshift_proc_stats)

[macro_openshift_prometheus_metrics]
definition = (index=openshift* sourcetype=prometheus OR sourcetype=openshift_prometheus)

[macro_openshift_stats]
definition = (index=openshift* sourcetype=openshift_stats)
Creating the restricted role in Splunk
The next step is to create a role in Splunk, that will be able to see only the sock-shop Project.
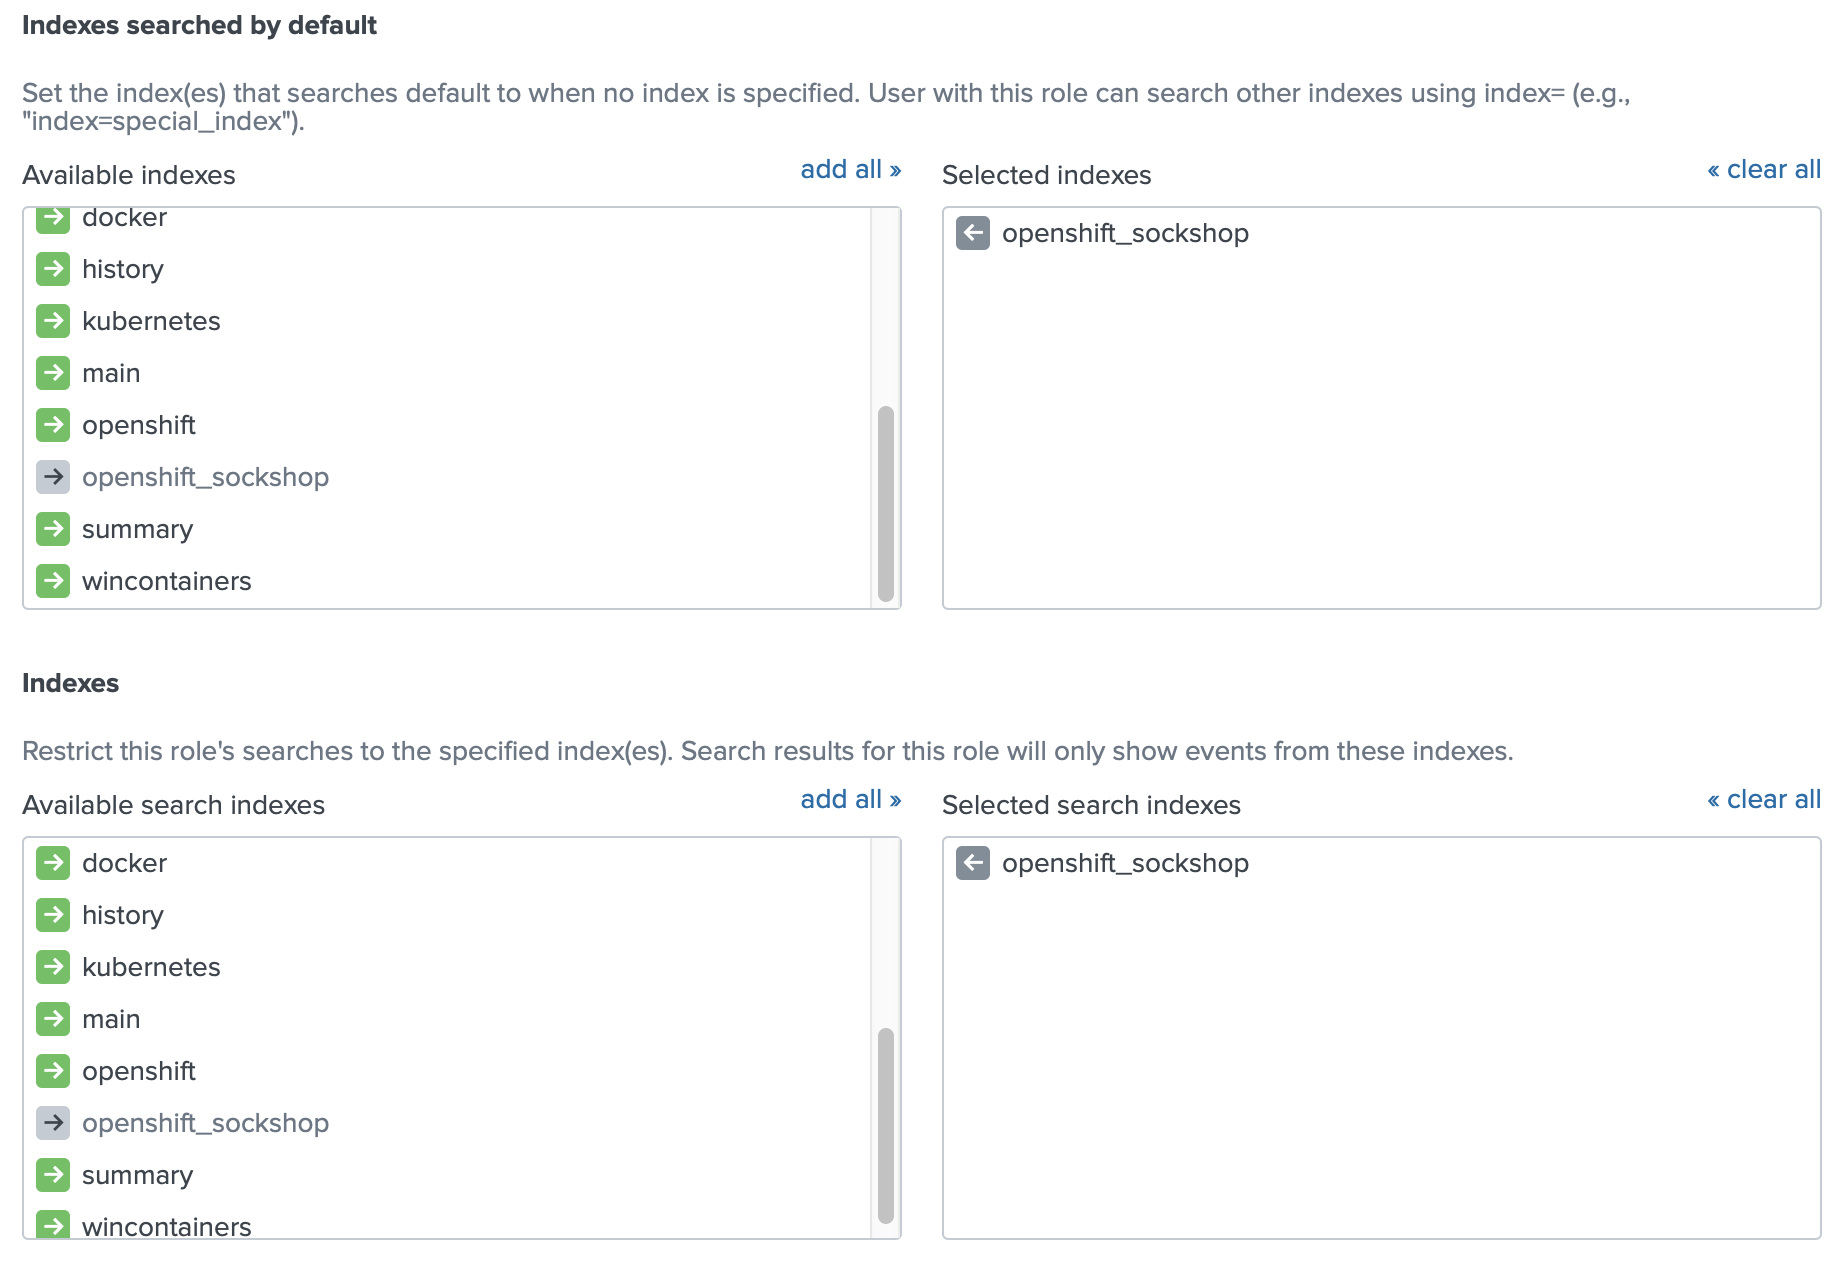
Restricting app developers only to their project with indexes
We will use the user role as an example. The only change we will do is to specify which indexes this role can see.
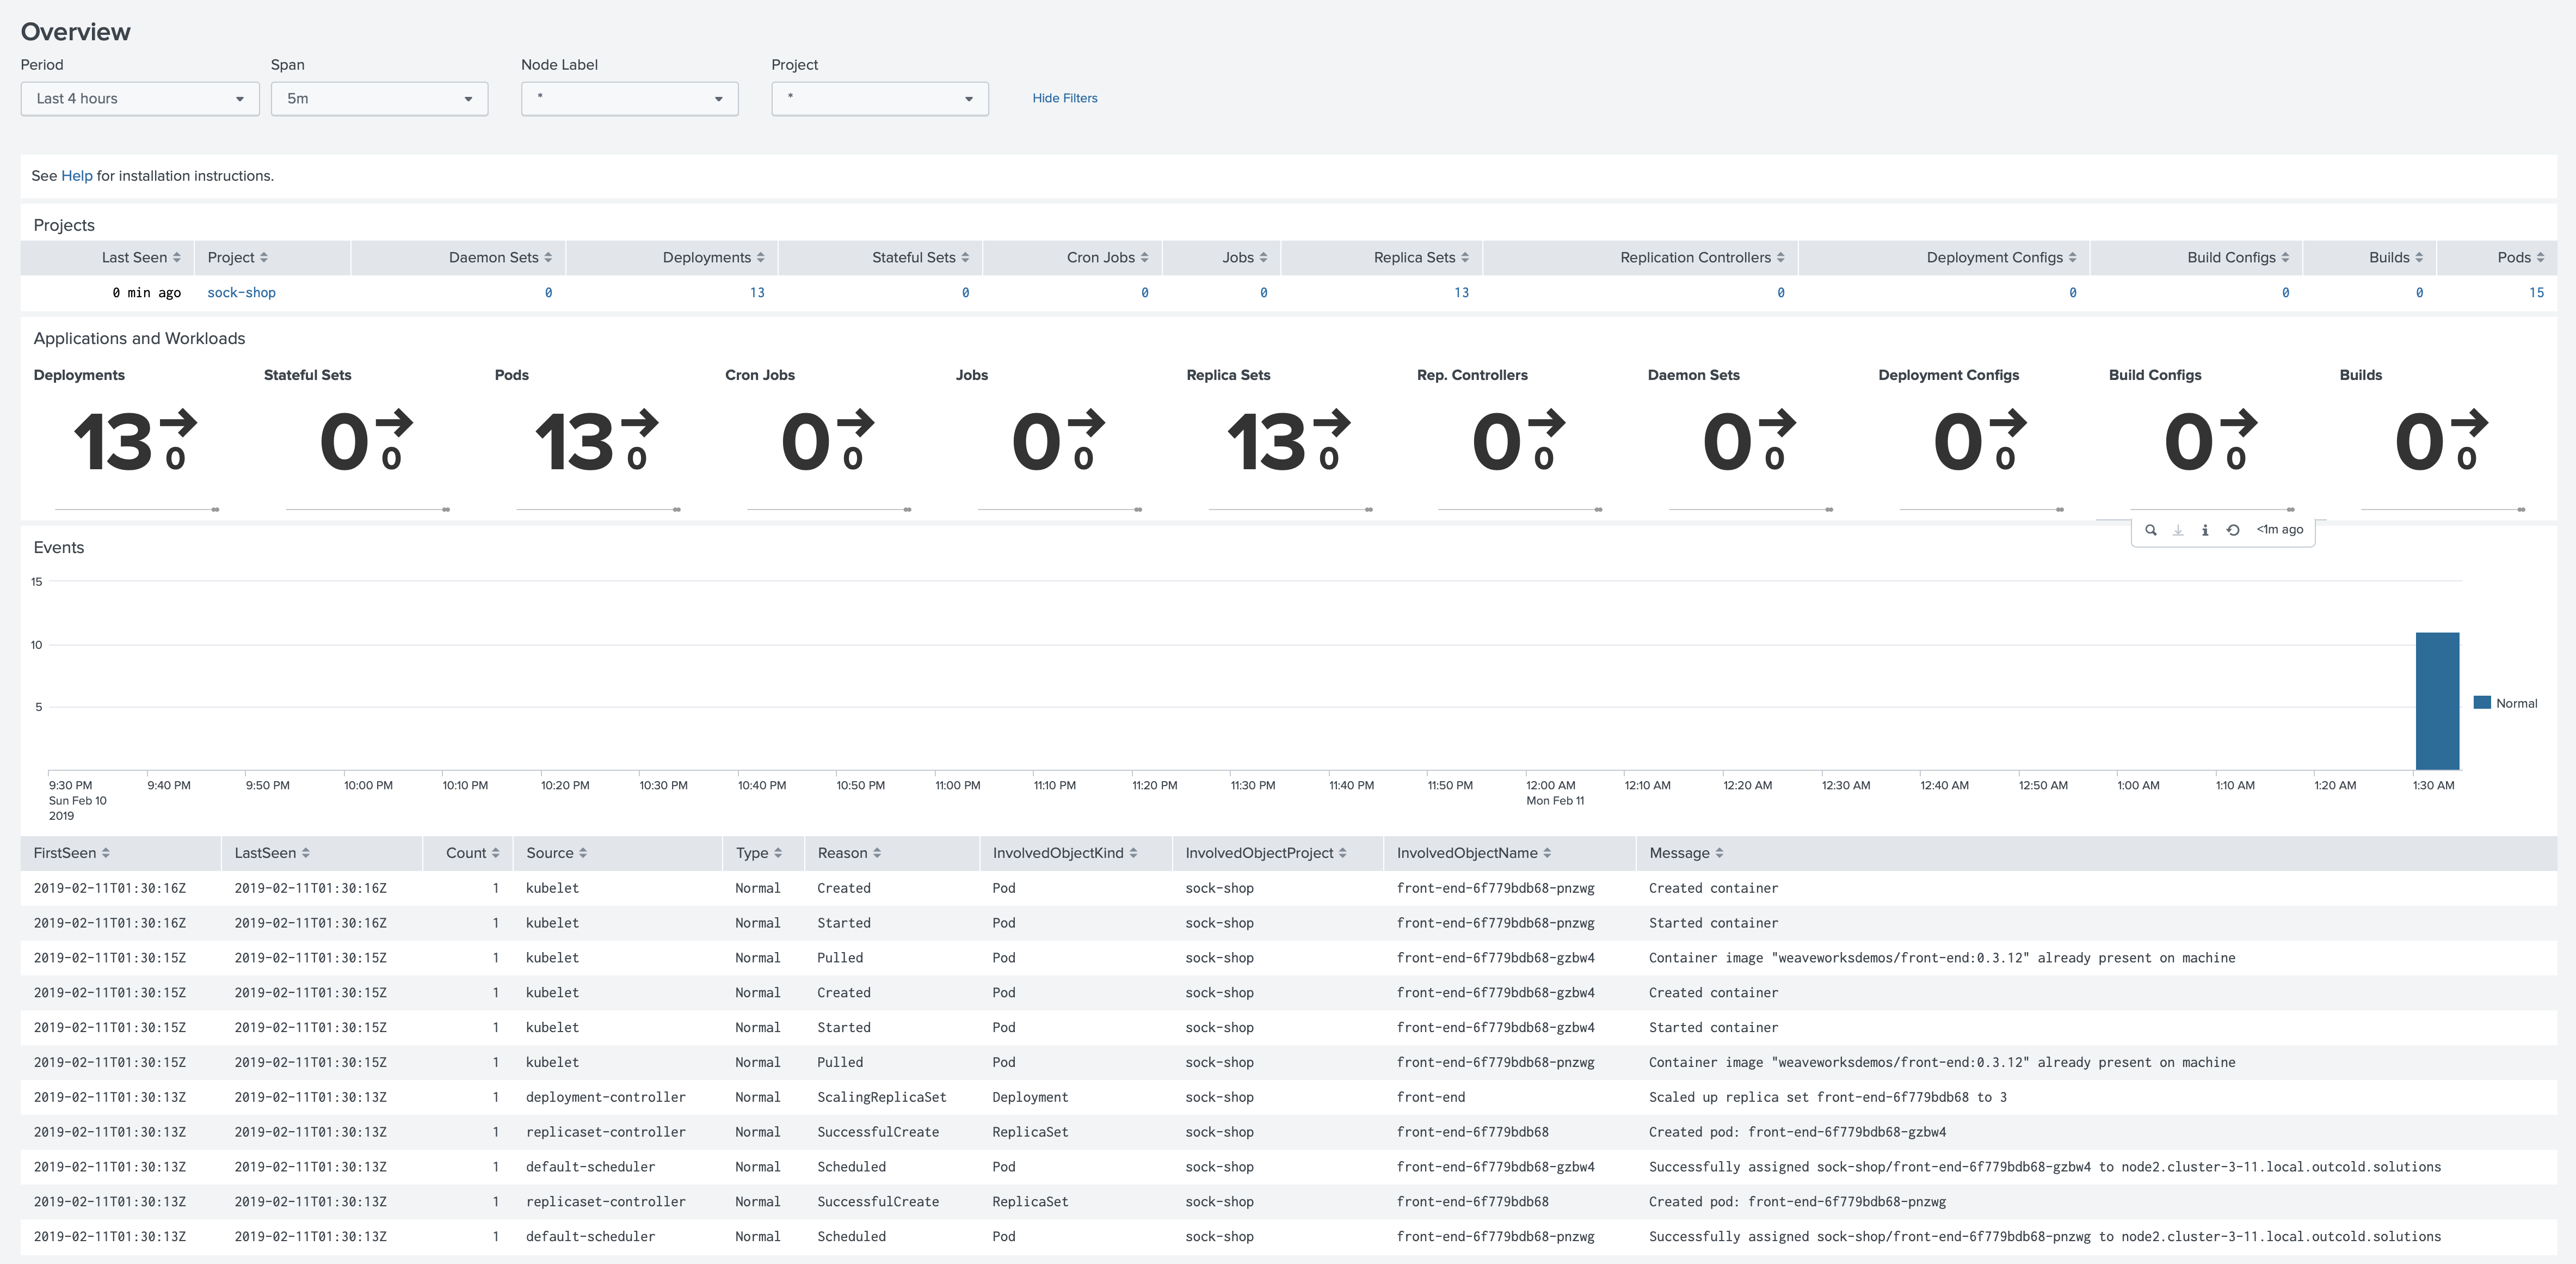
Now you can create a user with the role user. When you log in with this user you will see only one Project with the
Monitoring OpenShift application
Restrictions with Search Terms
Each log event and metric point from the Pods have metadata attached to it, which includes the field openshift_namespace.
We can leverage this indexed field and the Splunk Search Restrictions to be able to show only one project to the Splunk user.
Restricting app developers only to their project with search terms
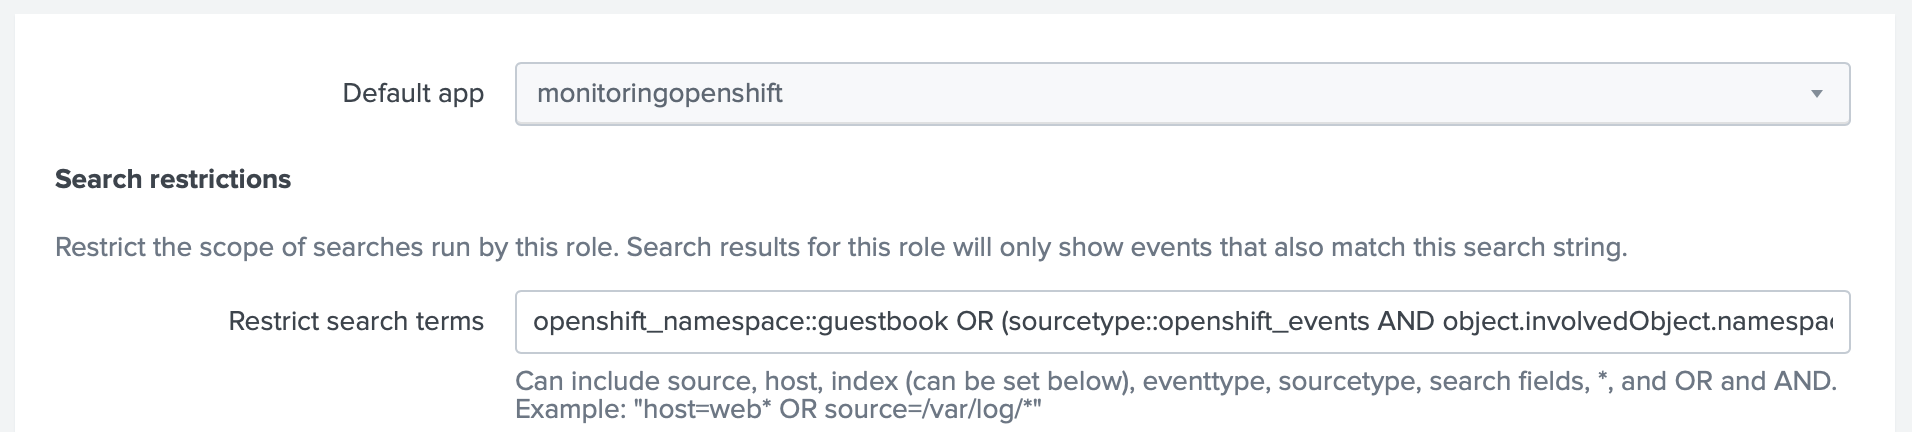
In this example we will let user role to see only the data from a guestbook Project. For that we will modify the user
role and specify a restriction openshift_namespace::guestbook OR (sourcetype::openshift_events AND object.involvedObject.namespace=guestbook) (double colon means that this search only will be applied
to the indexed fields)
Starting from version 5.6 you only need restricting by the indexed field
openshift_namespace::guestbook
We also need to be sure that this user can see the data from the OpenShift index, and this index is searchable by default (otherwise we will need to modify the macros, see the example above in the section Making data visible)
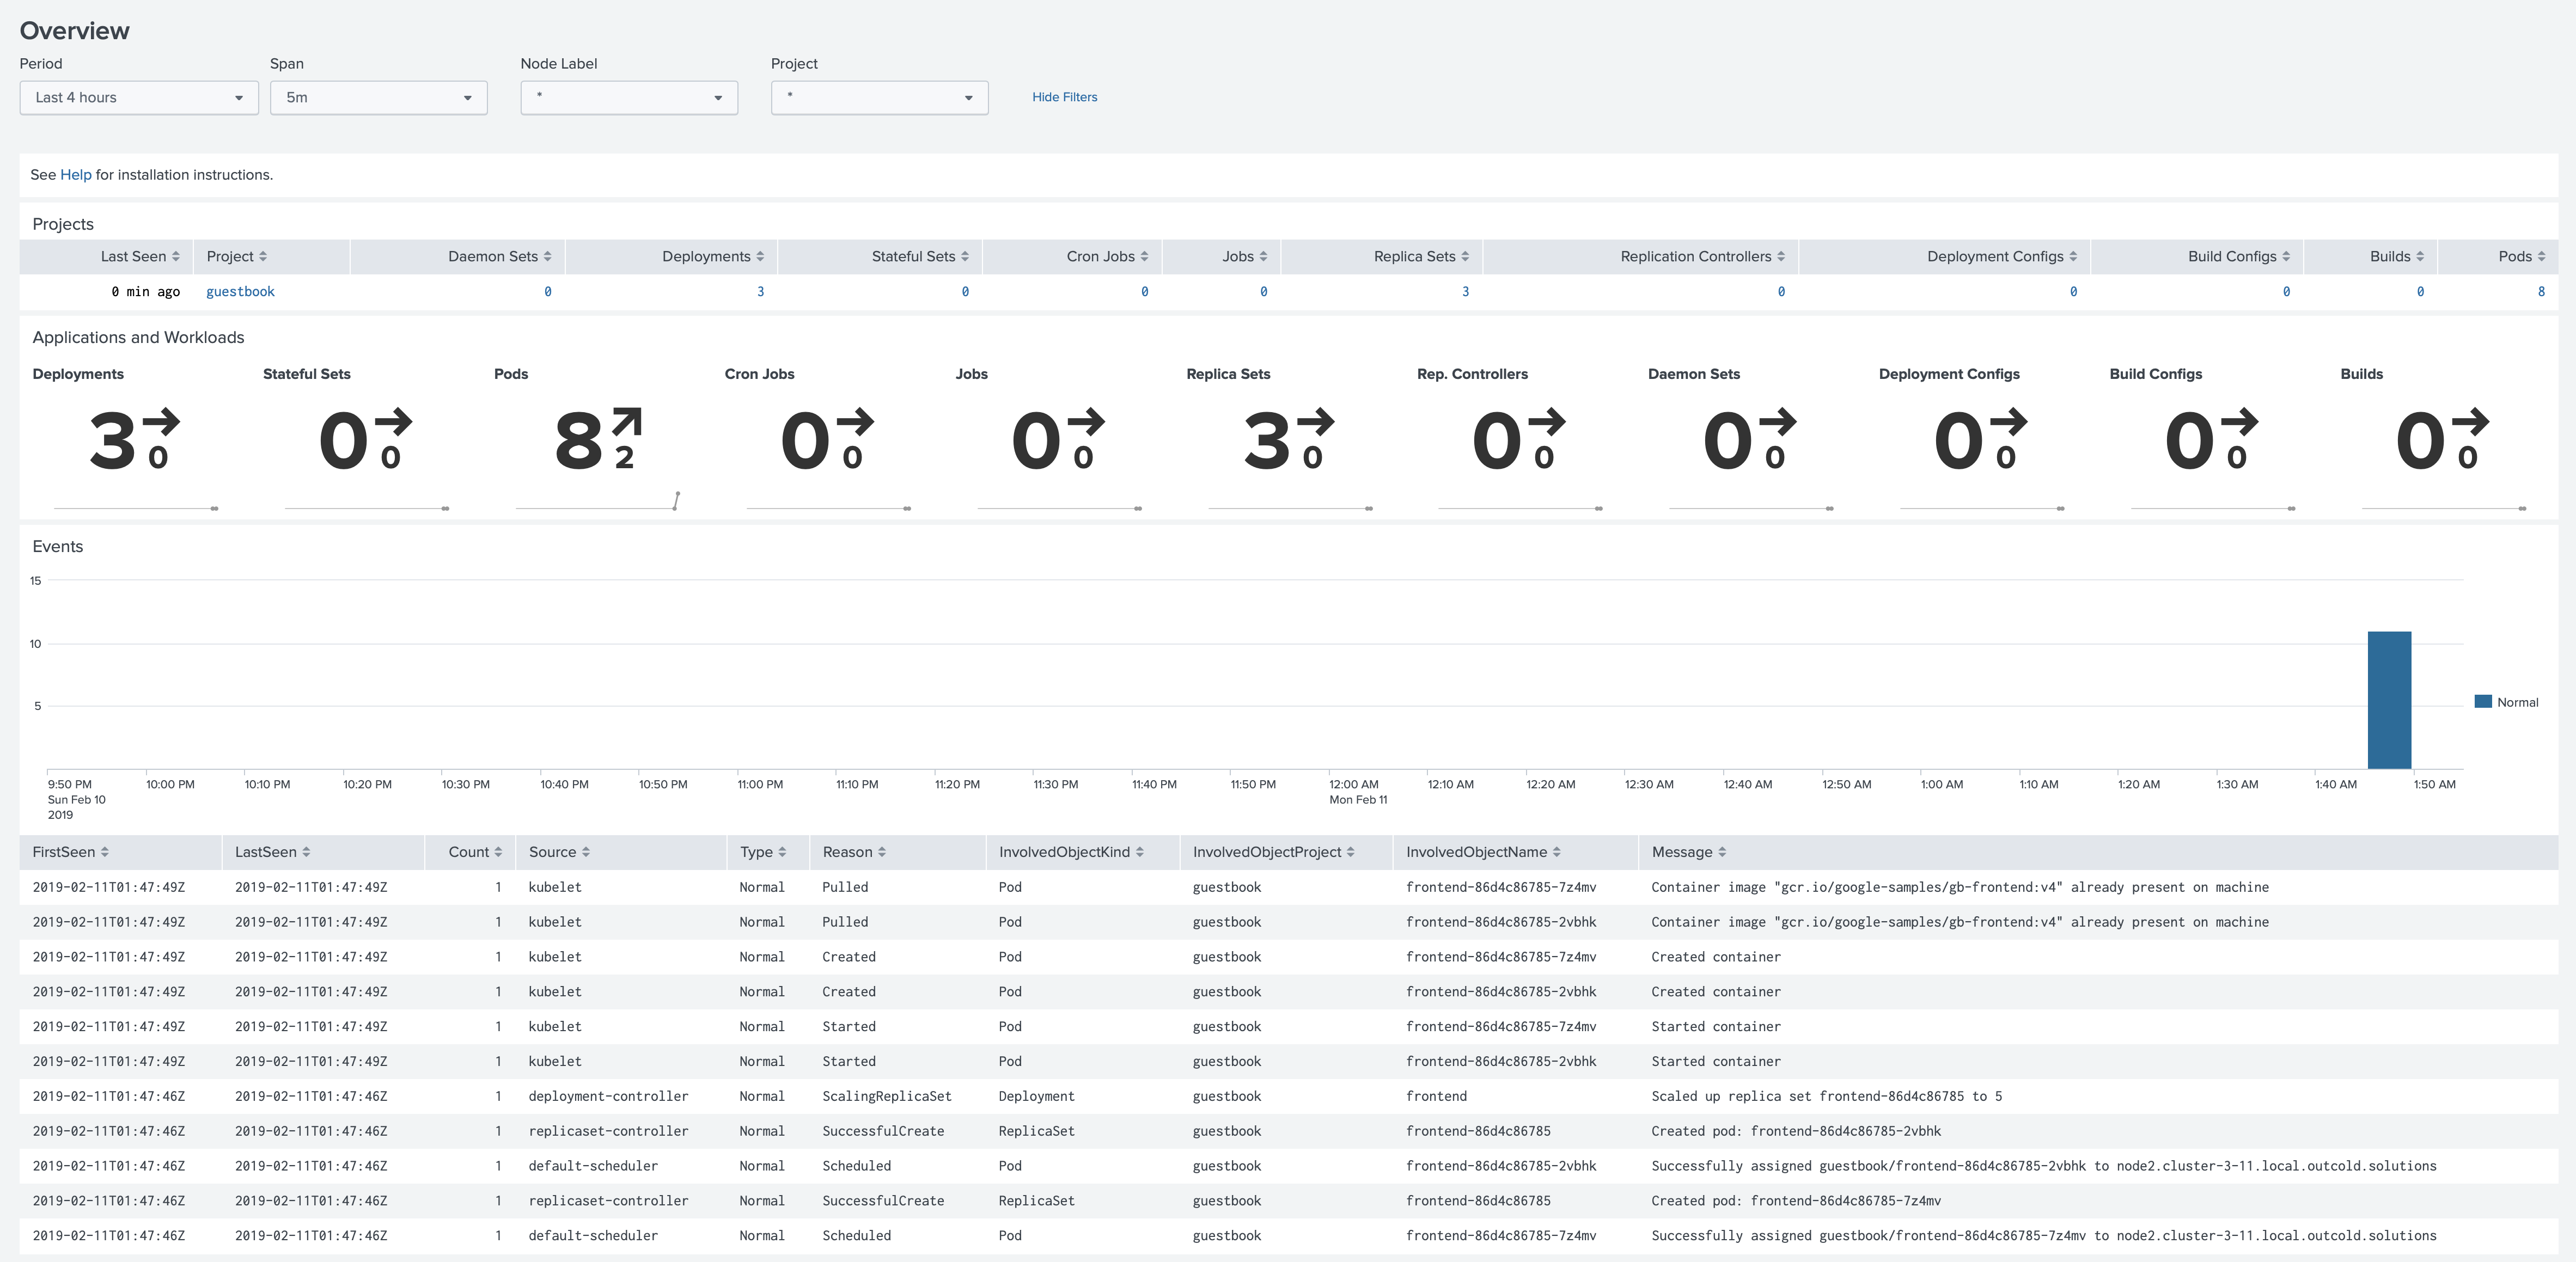
Now you can create a user with the role user. When you log in with this user you will see only one Project with the
Monitoring OpenShift application
A note about the security
Important note about this method from Securing Splunk Enterprise > Add and edit roles with Splunk Web.
Search term restrictions offer limited security. A user can override some search term restrictions if they create a calculated field that references a field name listed here as a restricted term.
Be aware that this method is less secure. Although we tried to break it by creating a calculated field
openshift_namespace=coalesce(if(openshift_namespace=="guestbook", "guestbook", null), "guestbook")
With this calculated field you cannot see the logs outside of your project when you specify a Search Term Restriction
like openshift_namespace::guestbook, because this term is looking only for indexed fields.
If you change it to openshift_namespace=guestbook, you will be able to see the logs from other namespaces by
using the calculated field as in the example above.
Conclusion
Both methods allow you to restrict which projects a user can see with Splunk. Splunk claims that restriction with
Search Terms is not very secure, but we could not find how to escape the existing Project, when openshift_namespace
is an indexed field.
The method with restricting by indexes gives you more flexibility. You can decide for each index how long you want to retain the data. If one team is logging much more than the other, that will not affect performance for the teams, as each team will have its index. Of course managing one index per Project might require more configurations on both sides, OpenShift and Splunk as well.


