All our solutions are powered by the Collectord, a container-native software built by Outcold Solutions that provides capabilities for discovering, transforming and forwarding logs, collecting system metrics, collecting metrics from the control plane of the orchestration frameworks and forwarding network activity. Collectord provides flexible and powerful tools for transforming logs. With our software you can hide sensitive information from the loglines before forwarding them. With Collectord you can reduce the licensing costs associated with logging aggregation by choosing which data you want to forward from the log streams. Collectord forwards container logs, host logs and can discover logs written by the containerized applications.

Outcold Solutions provides solutions for monitoring Kubernetes, OpenShift and Docker clusters in Splunk Enterprise and Splunk Cloud. We offer certified Splunk applications, which give you insights across all containers environments. We are helping businesses reduce complexity related to logging and monitoring by providing easy-to-use and deploy solutions for Linux and Windows containers. We deliver applications, which help developers monitor their applications and operators to keep their clusters healthy. With the power of Splunk Enterprise and Splunk Cloud, we offer one solution to help you keep all the metrics and logs in one place, allowing you to quickly address complex questions on container performance.


See detailed metrics from containers and processes, including performance metrics, utilization metrics and security insights. Forward application-specific metrics, exported in Prometheus format. Use prebuilt Splunk dashboards for a comprehensive overview.
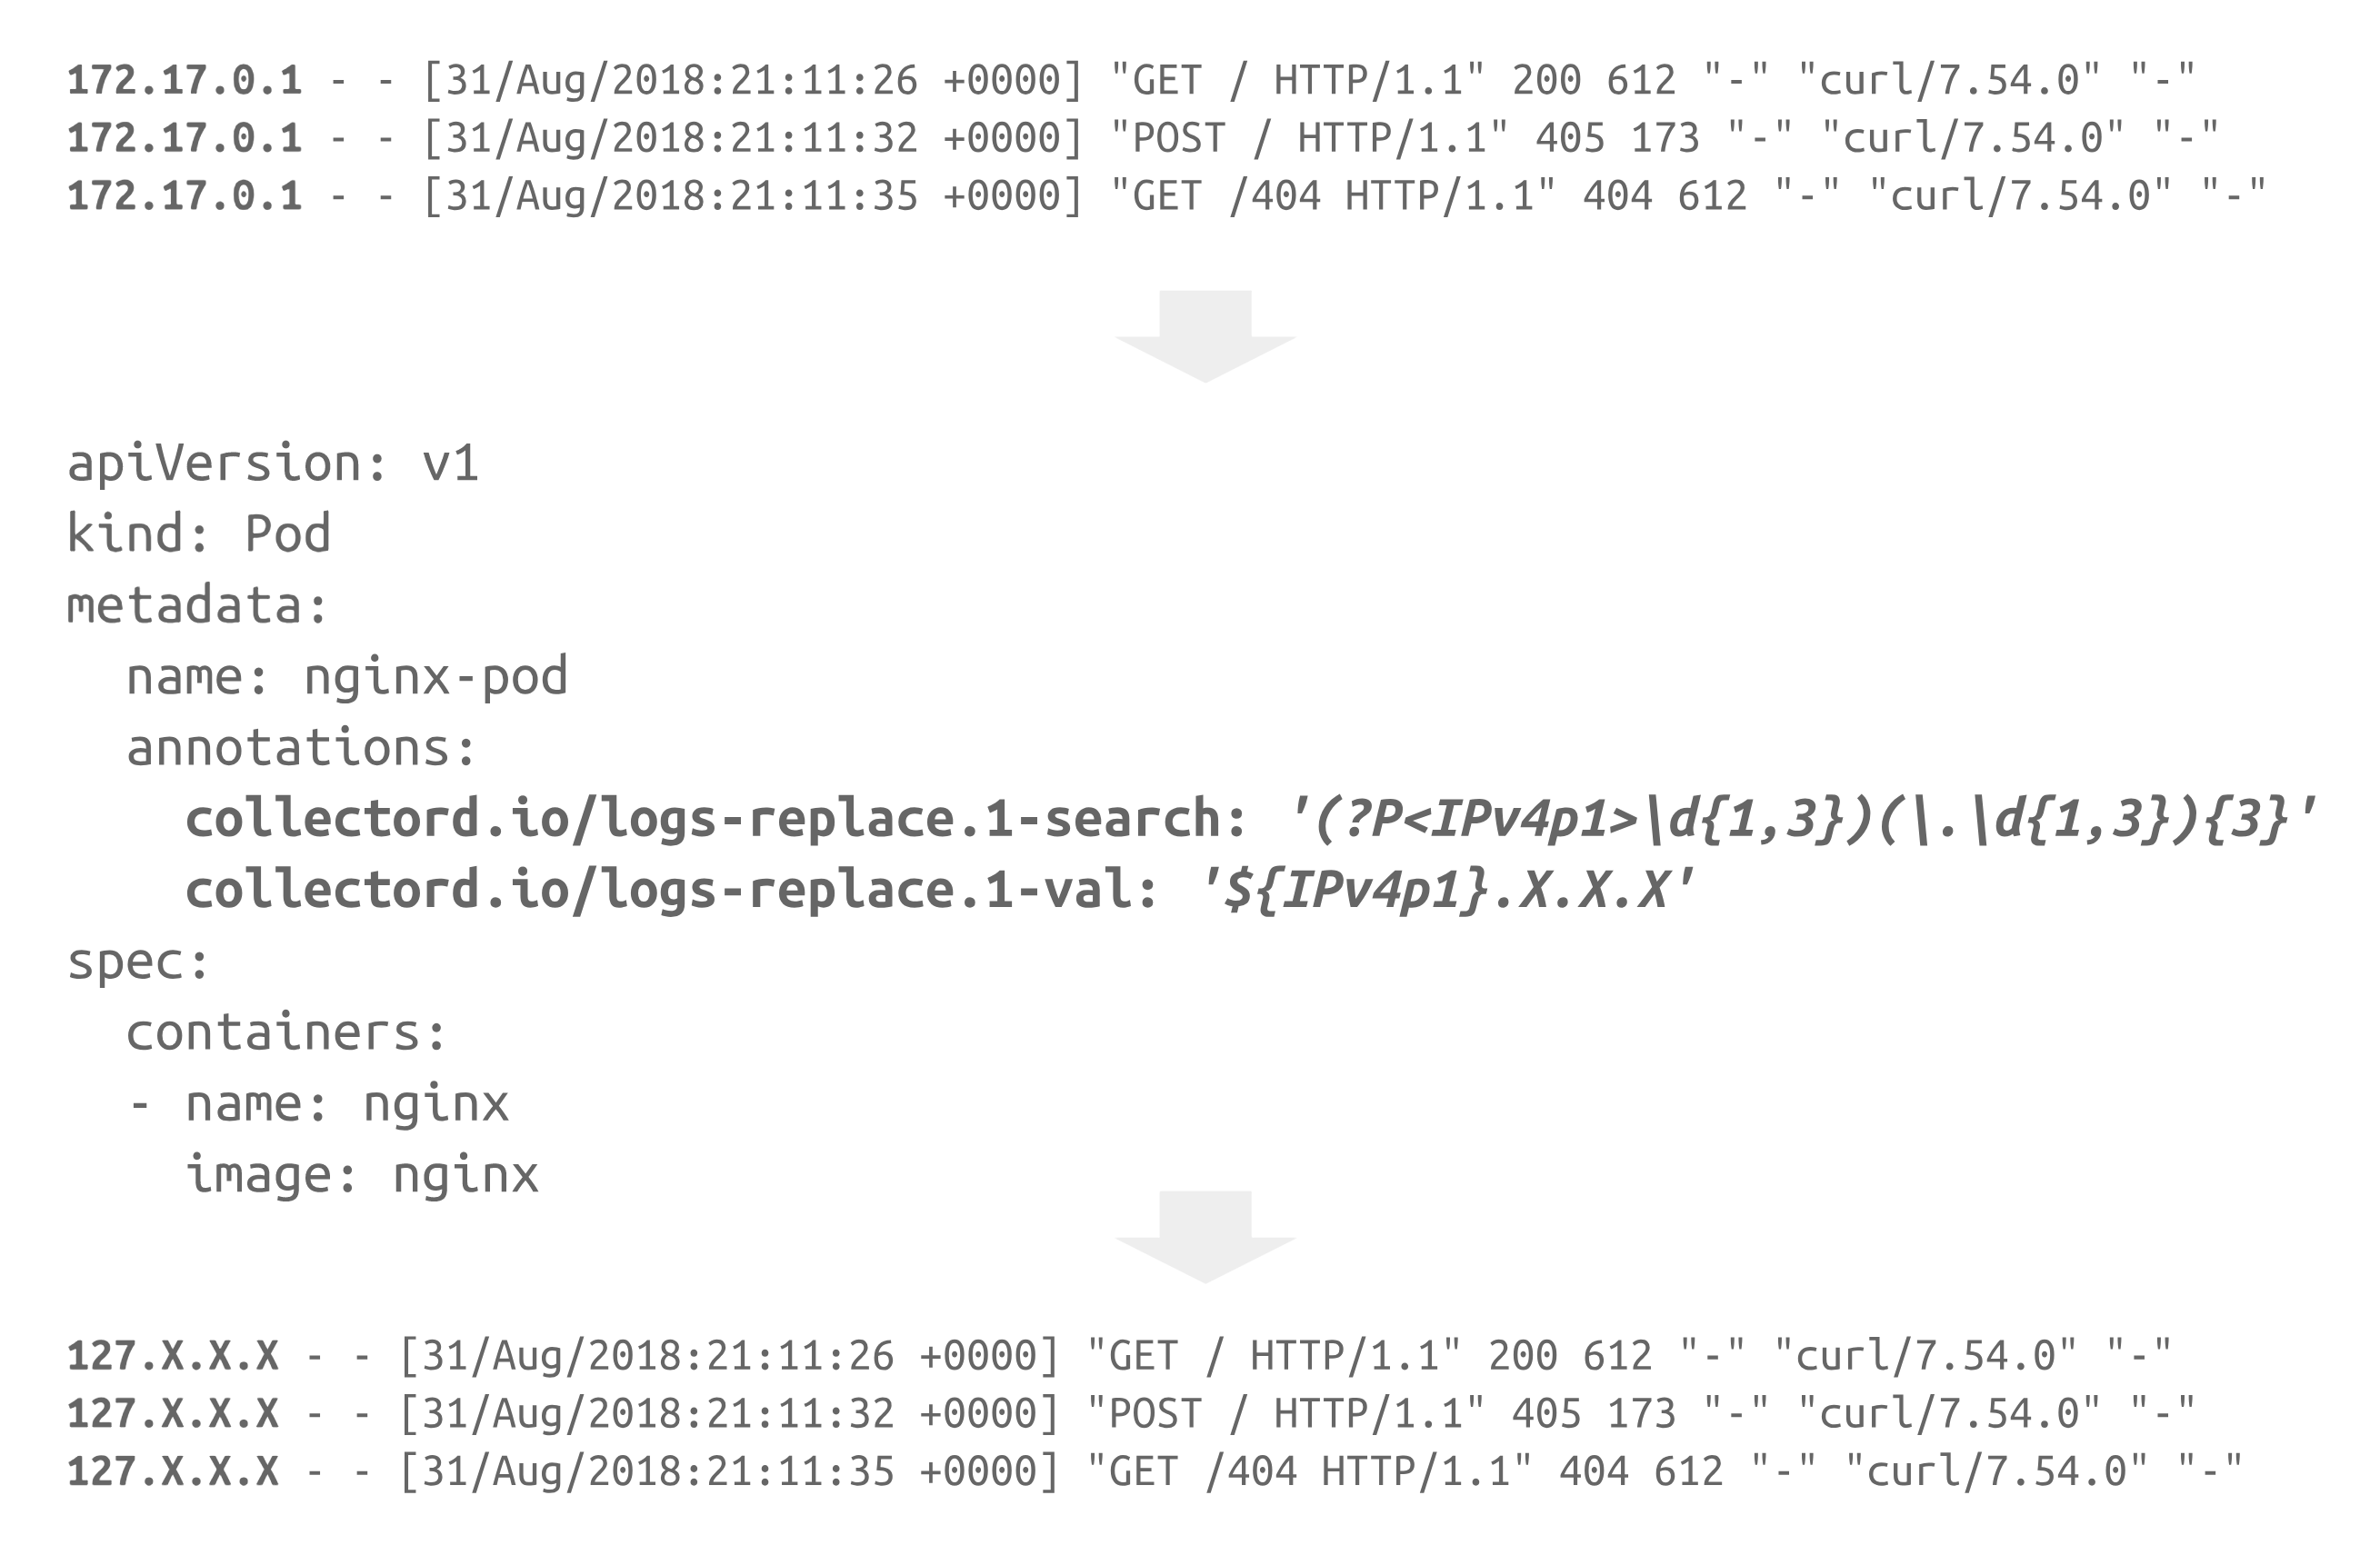
Aggregate logs from containers, applications, and servers. Use flexible mappings to filter logs enriched with container metadata, correlate logs with metrics, and leverage Splunk capabilities for analyzing logs. Use Collectord to transform logs before they reach Splunk, remove sensitive information, remove PII data to help keep your logs GDPR compliant. With Collectord you can reduce licensing and storage costs by choosing which loglines you want to forward.
Diagnose cluster issues by looking at historical events, monitoring allocations, and regulating cluster capacity. Leverage pre-built alerts for monitoring the health of the clusters out of the box.
Define access to the data by clusters, namespaces and even pods or containers. Review network activities, happening inside your cluster, and outside connections. Verify containers running with elevated security permissions. Use audit logs for monitoring changes in deployments.
Use one tool to collect and forward logs and metrics required by developers for reviewing performance and health of their applications. With the annotations developers can define how they want to see the data in log aggregation tool, specify multiline log patterns, removing terminal escape codes, override types, sources and indexes.
Container and application logs enriched with the metadata (name, labels, image).
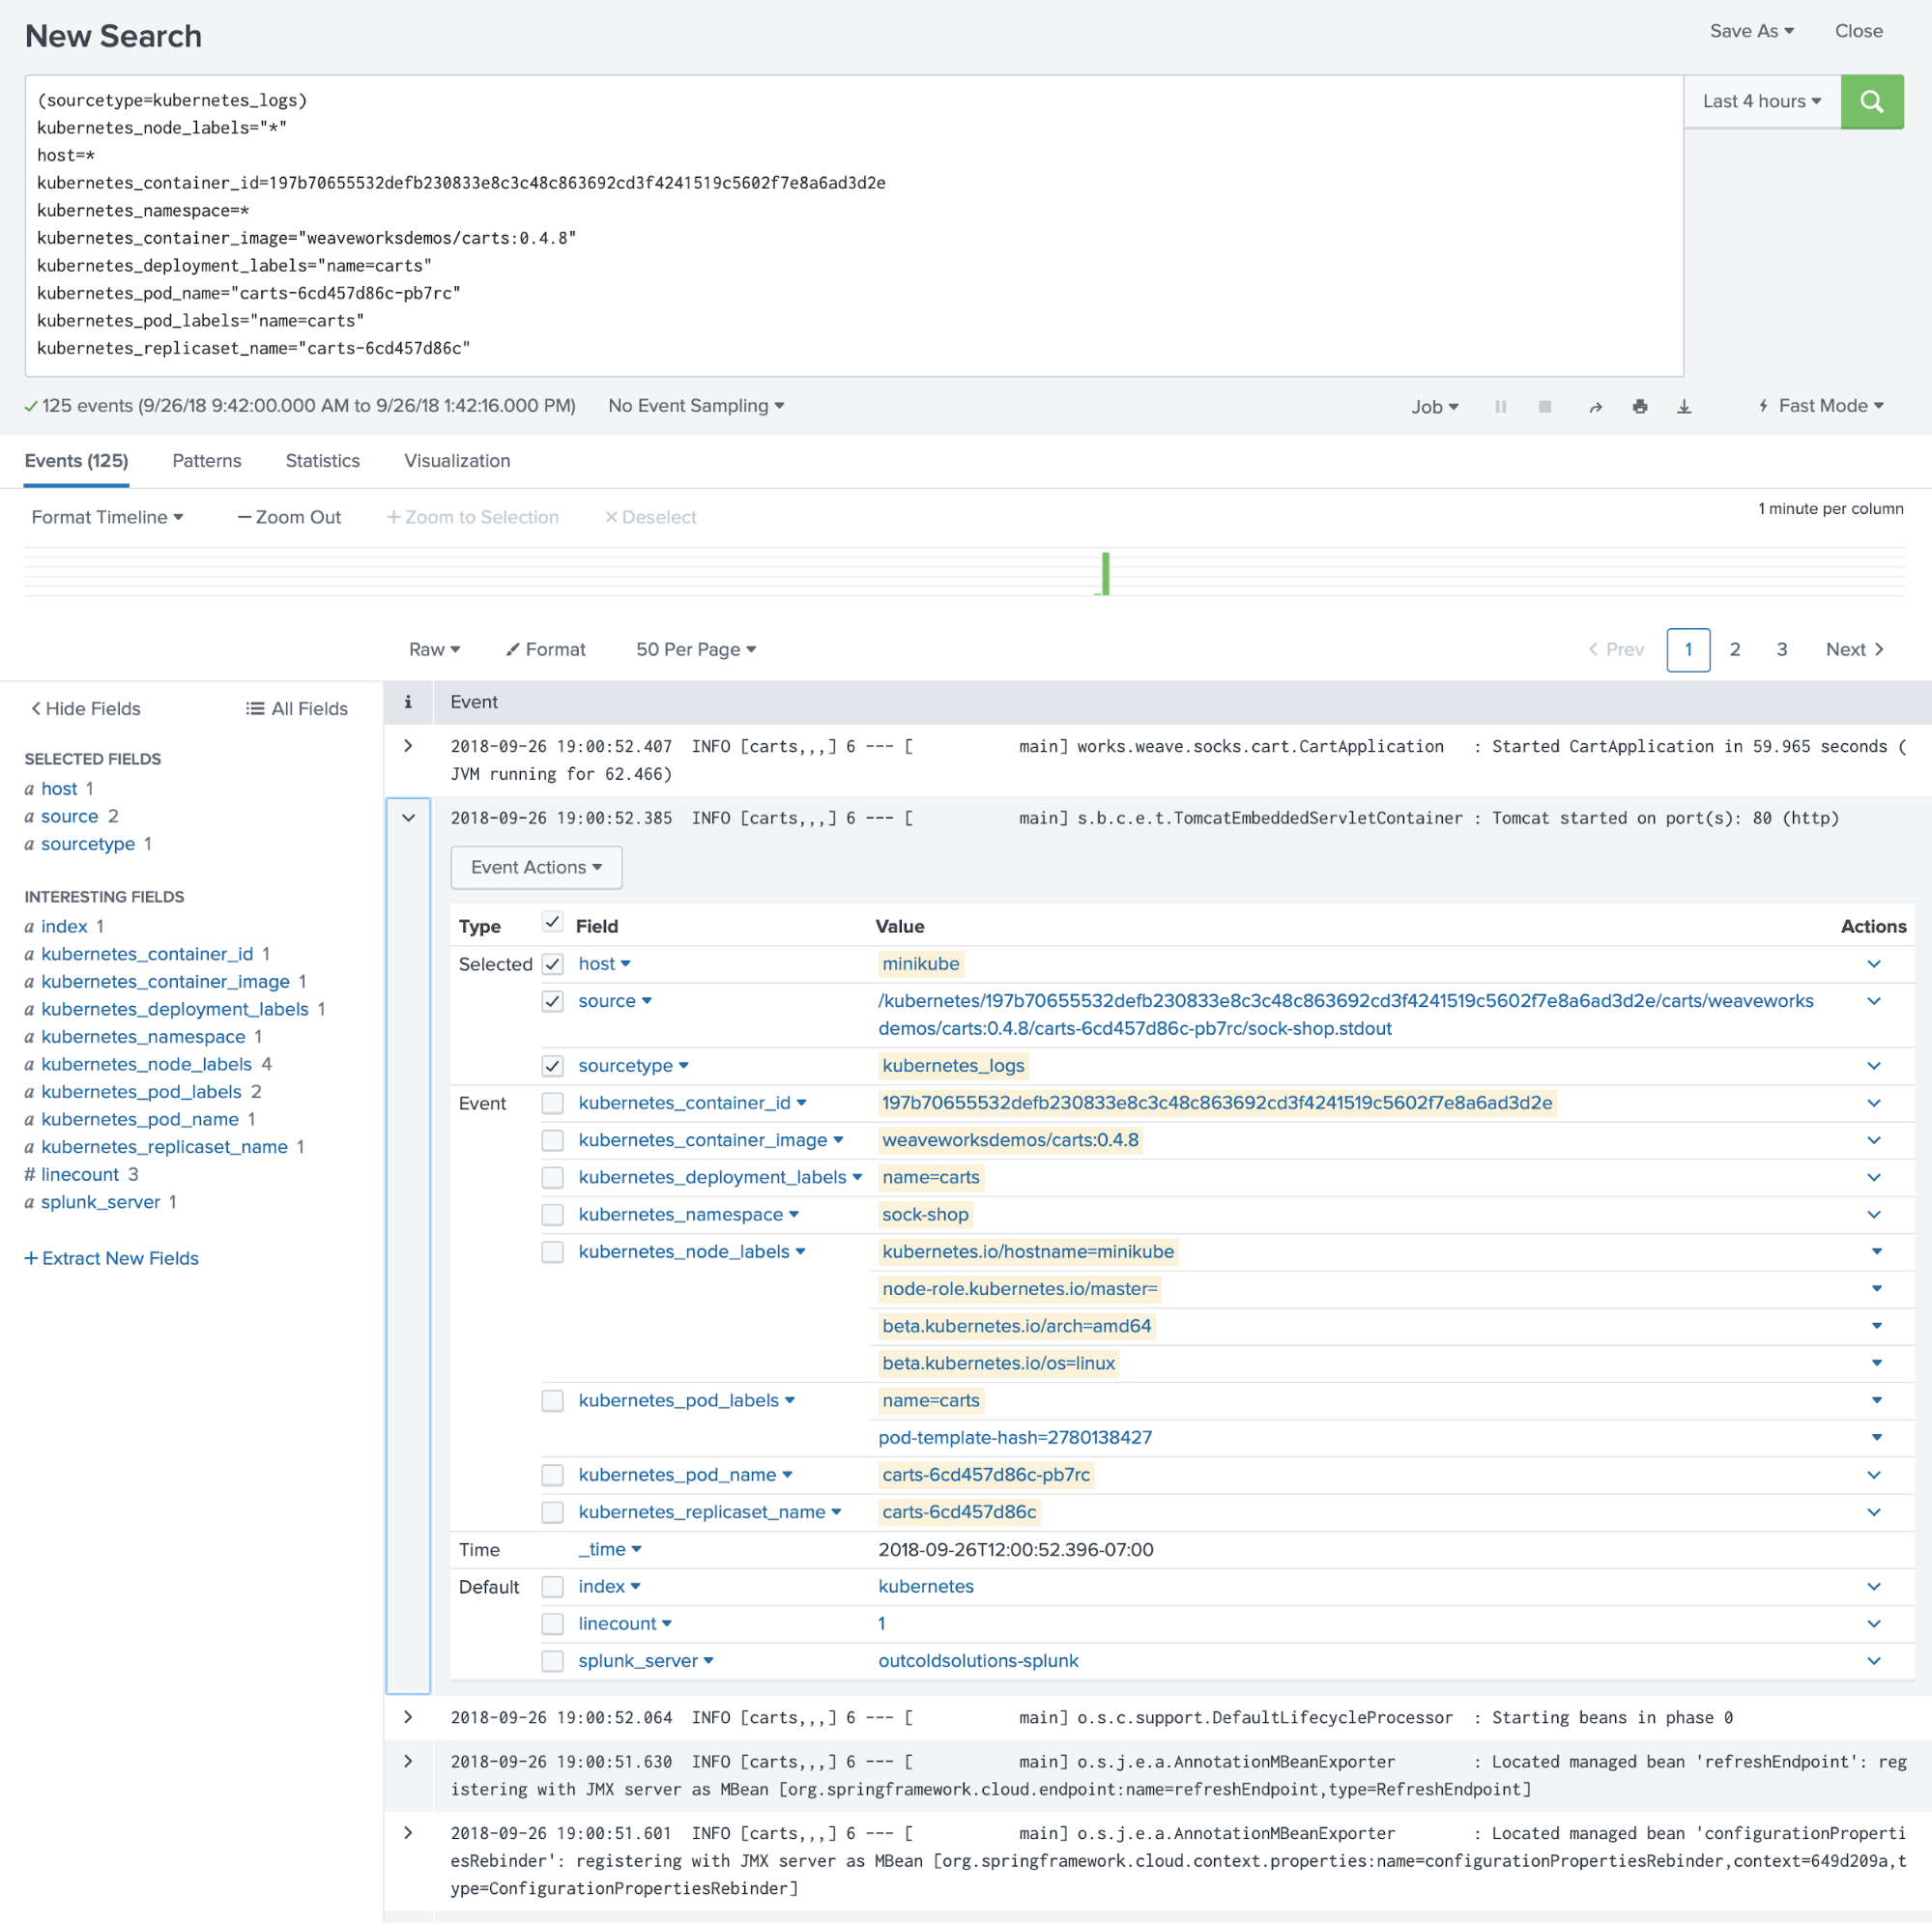
What happened? When did it happen? Who initiated it?

Define access to the data by clusters, namespaces and even pods or containers.
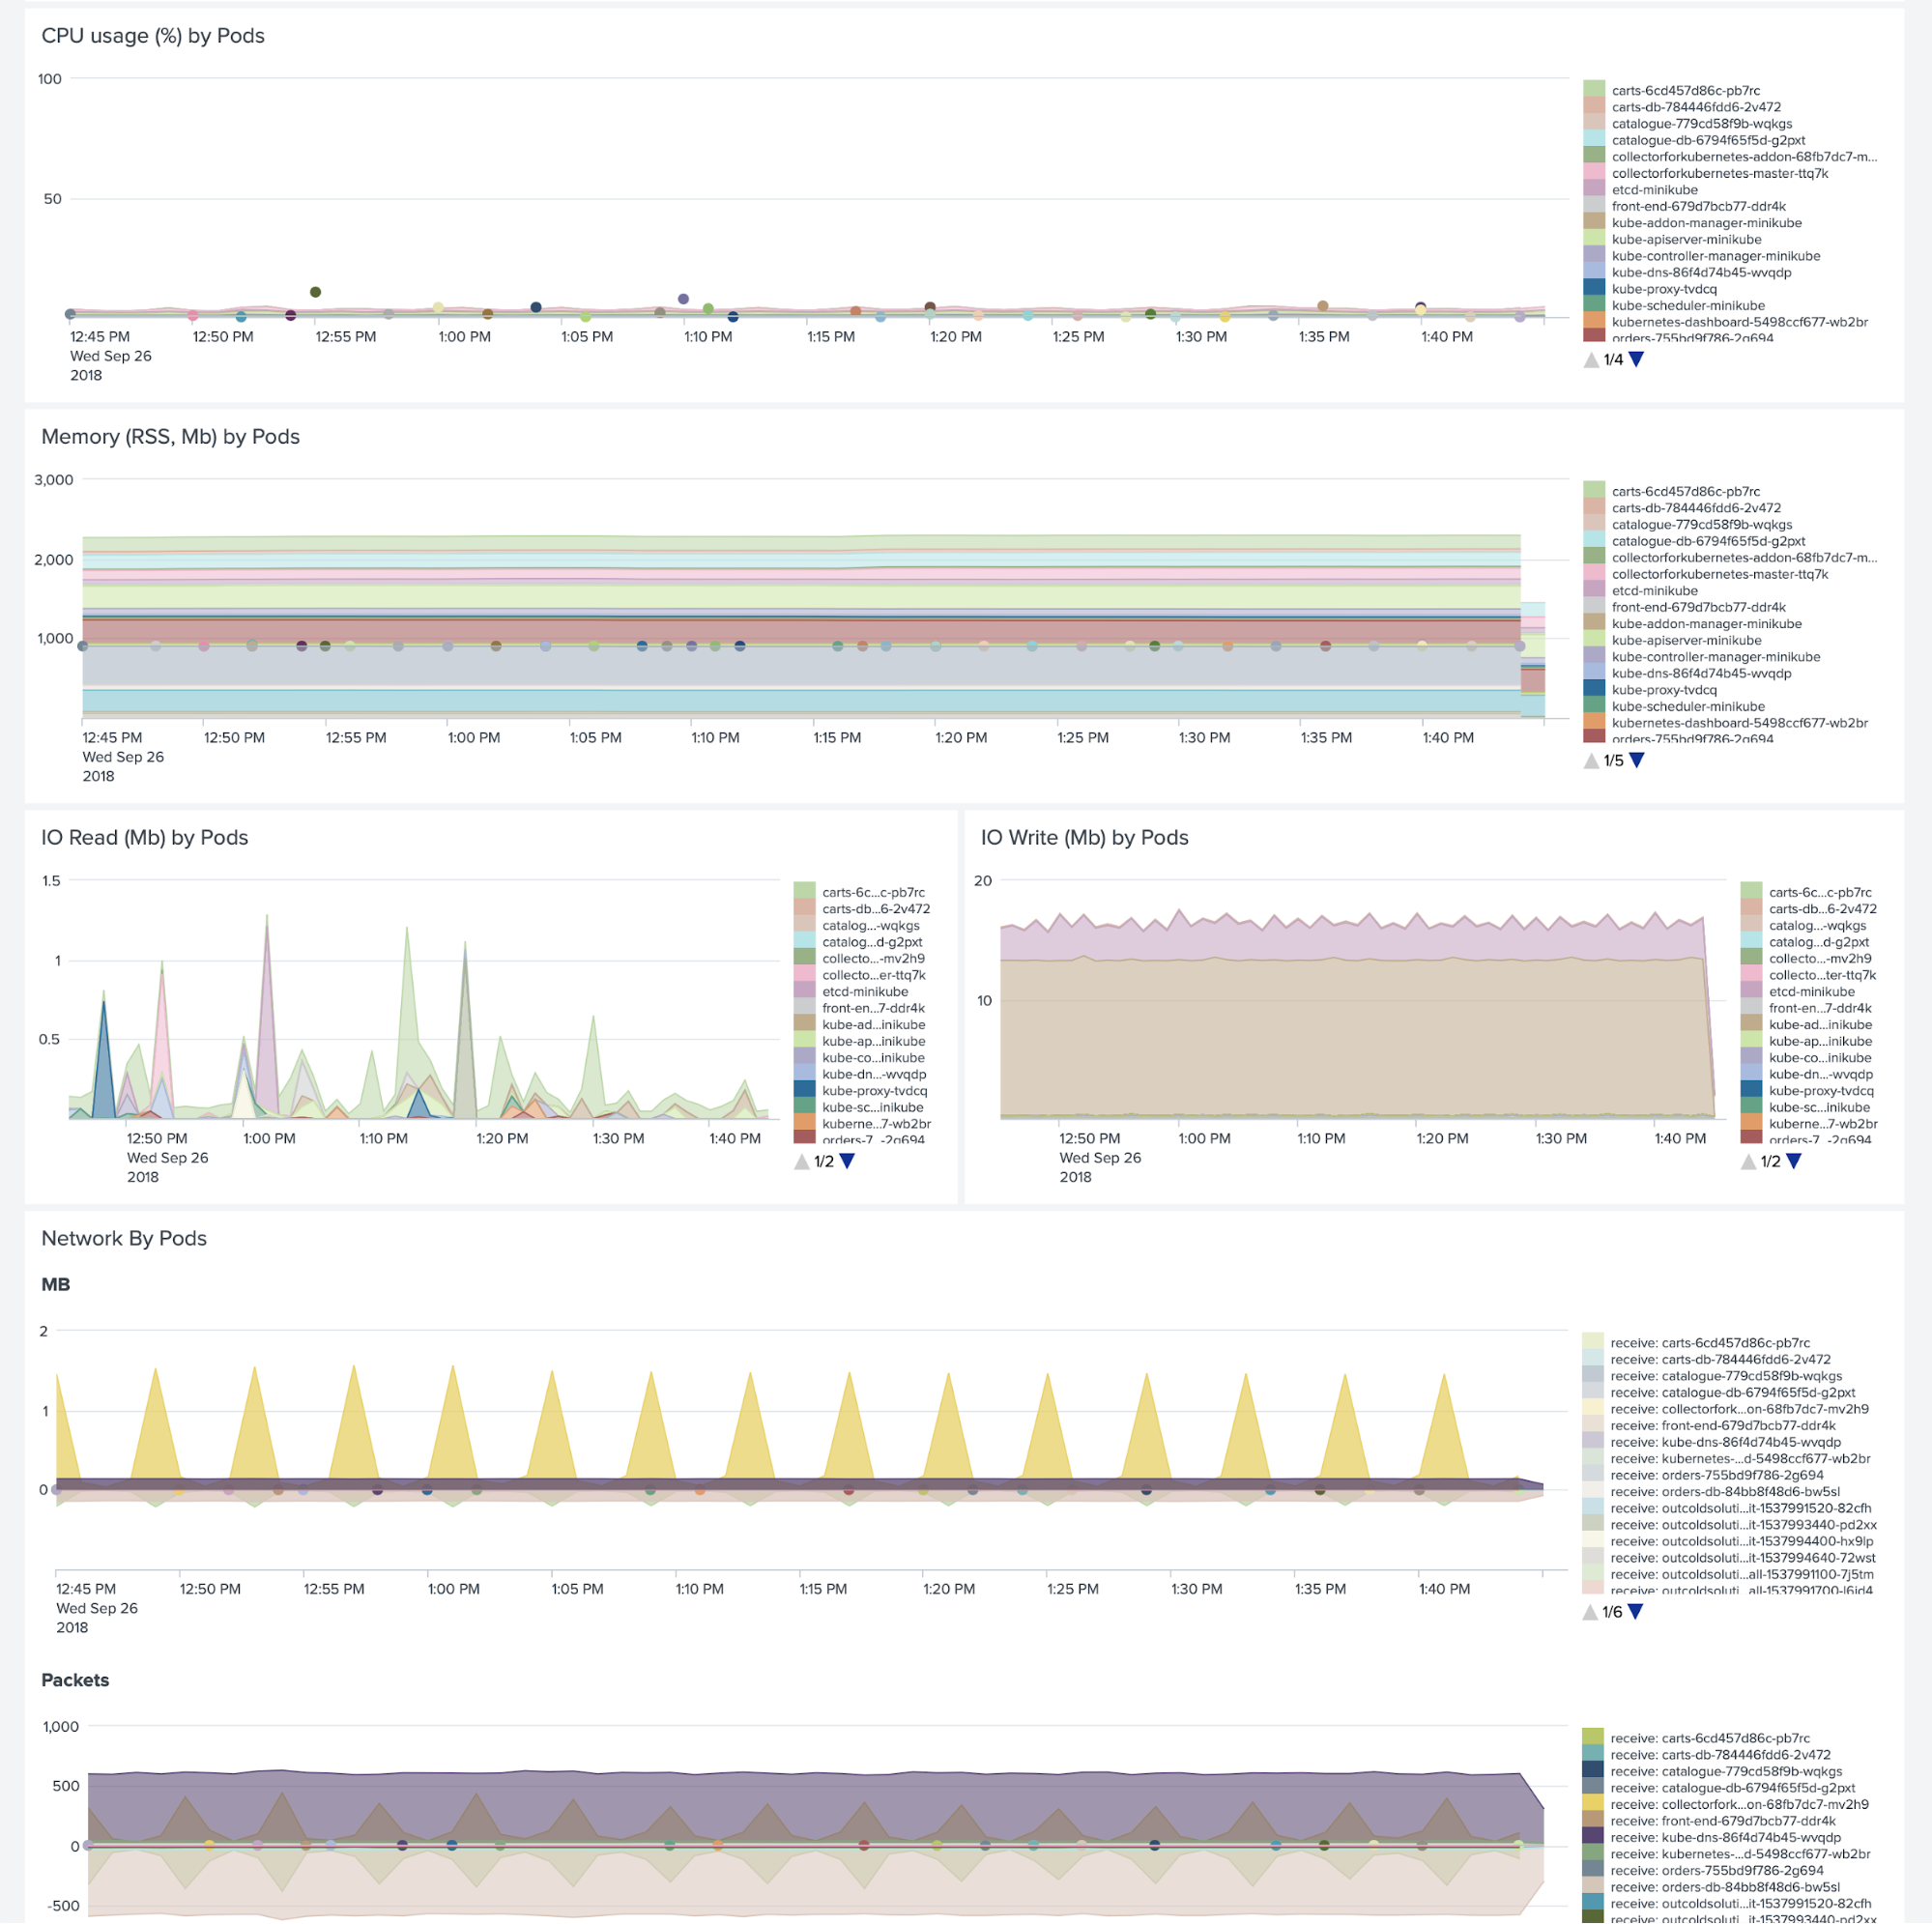
Cpu, Memory, Disk, Network. Review limits and requests of containers. Monitor process health with detailed information collected from proc filesystem.
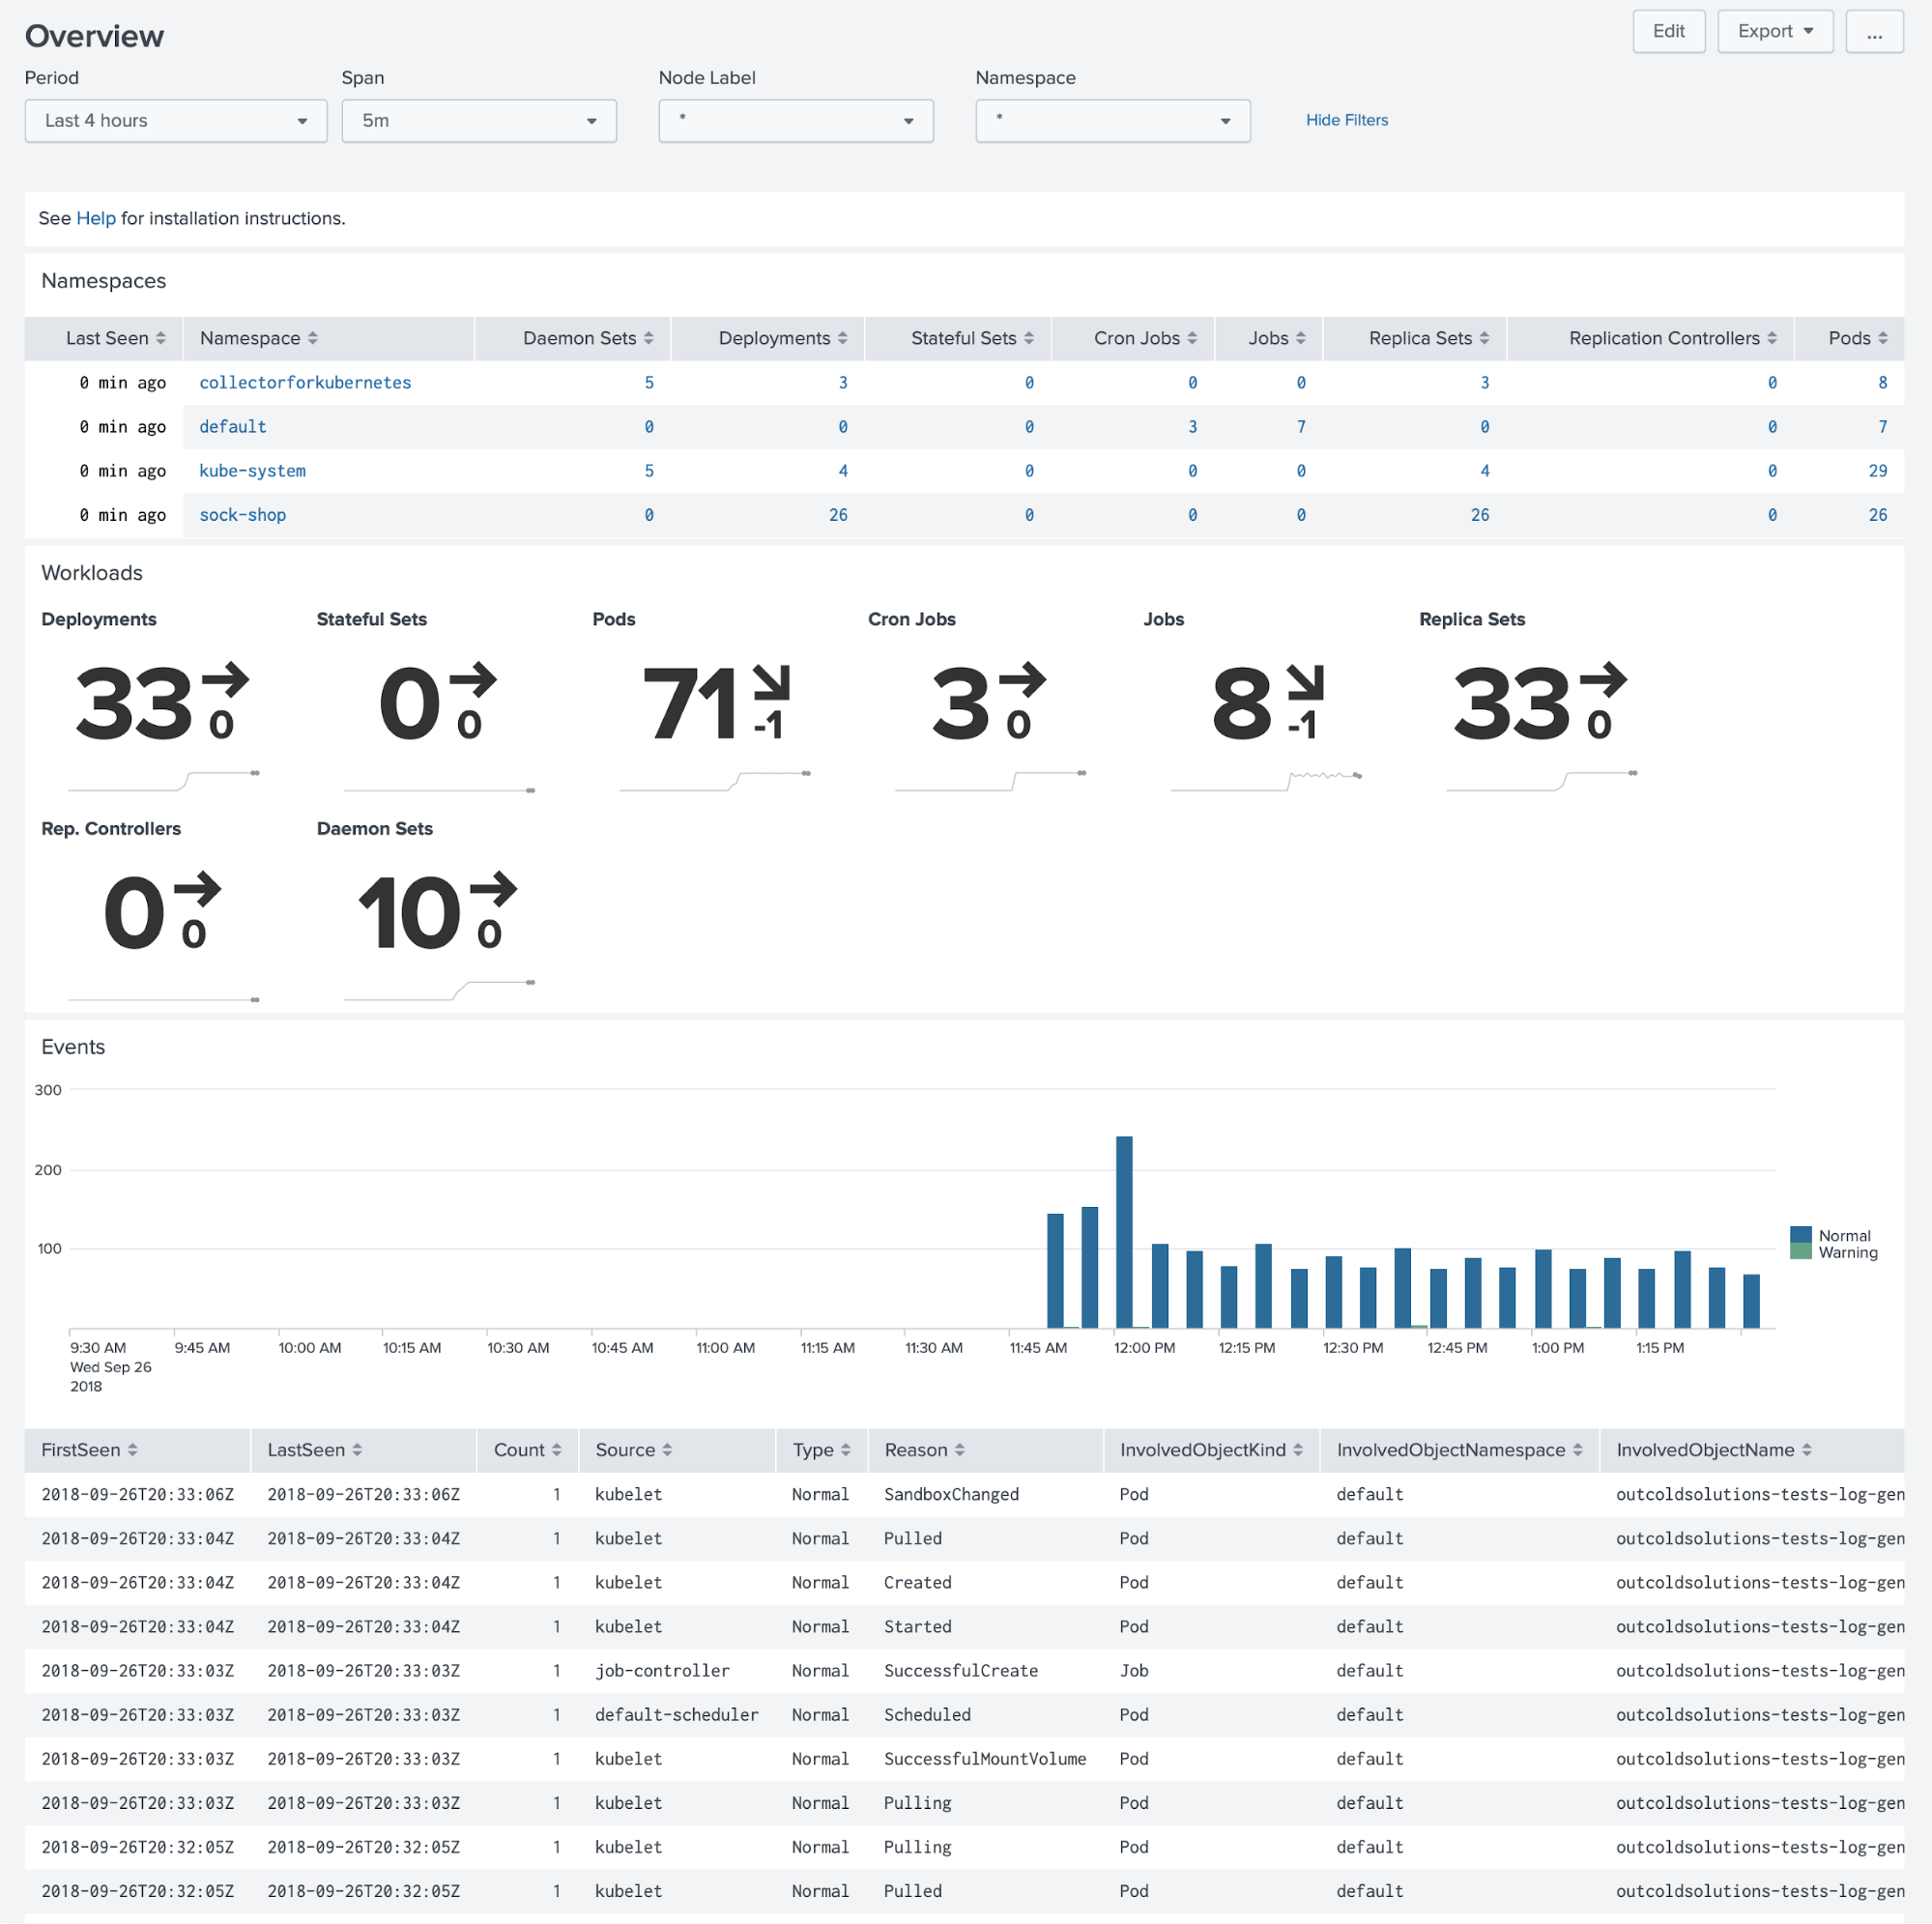
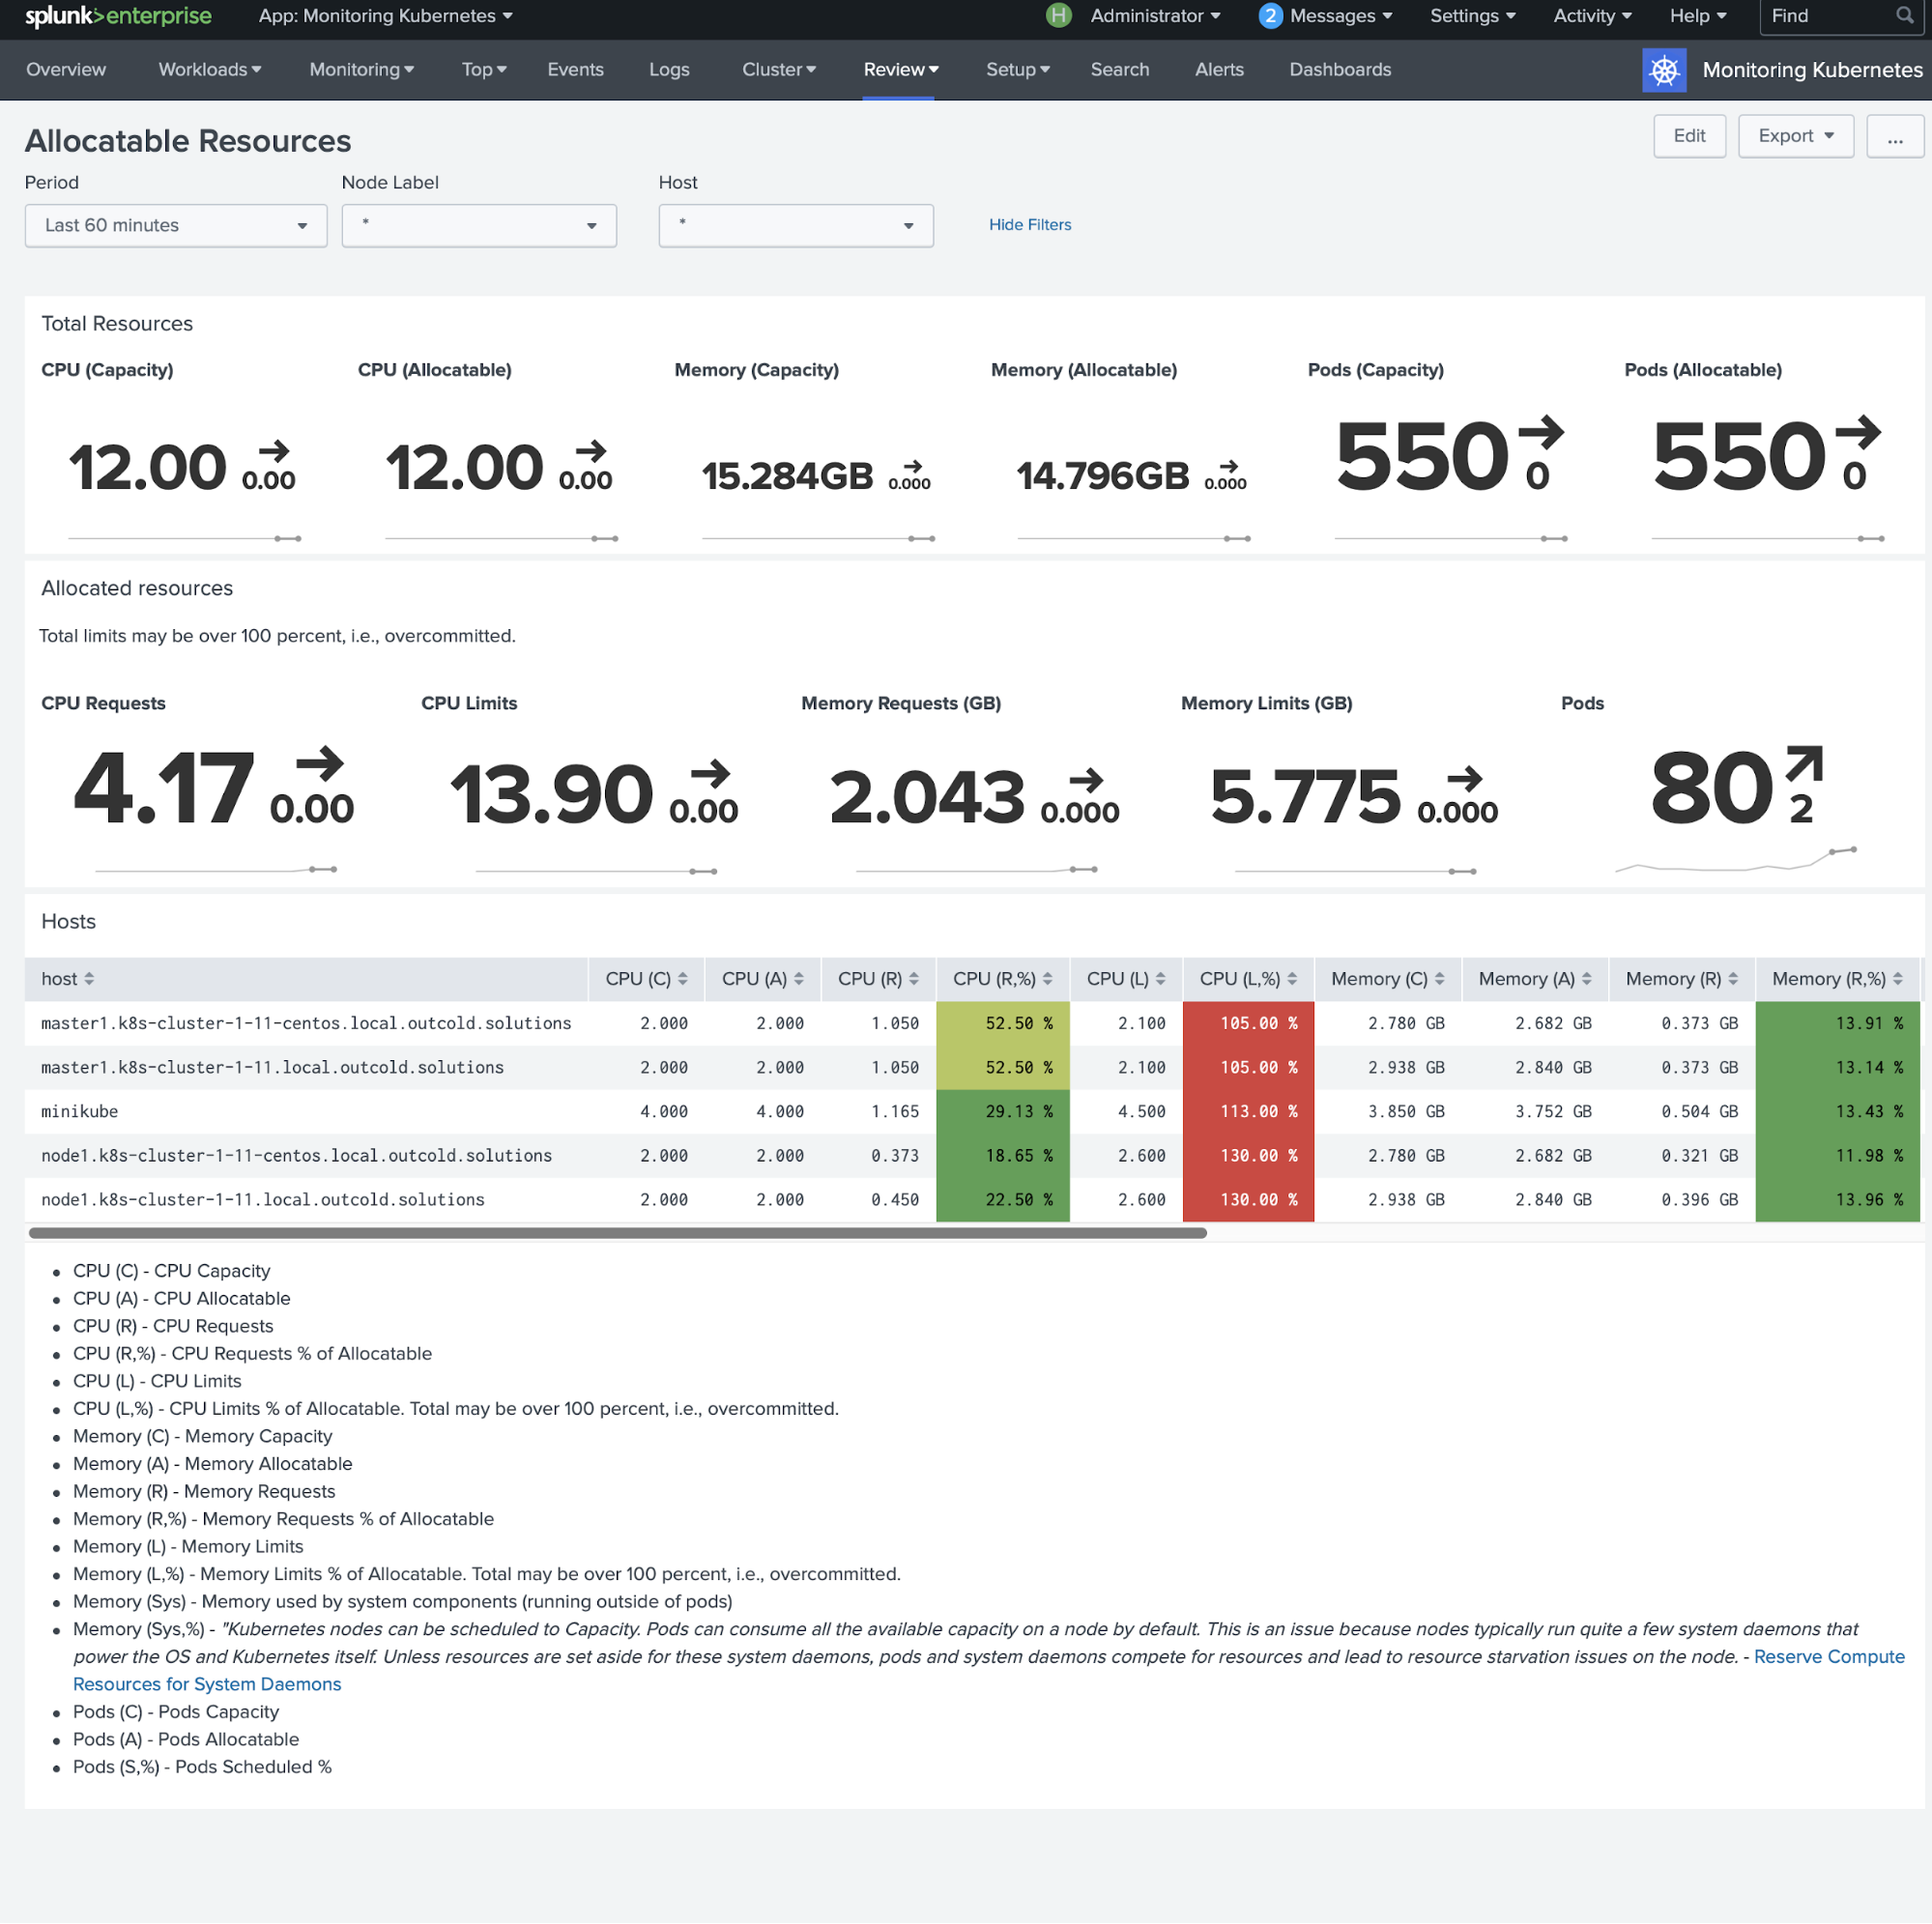
Diagnose cluster issues by looking at historical events, monitoring allocations, and regulating cluster capacity. Leverage pre-built alerts for monitoring the health of the clusters out of the box.
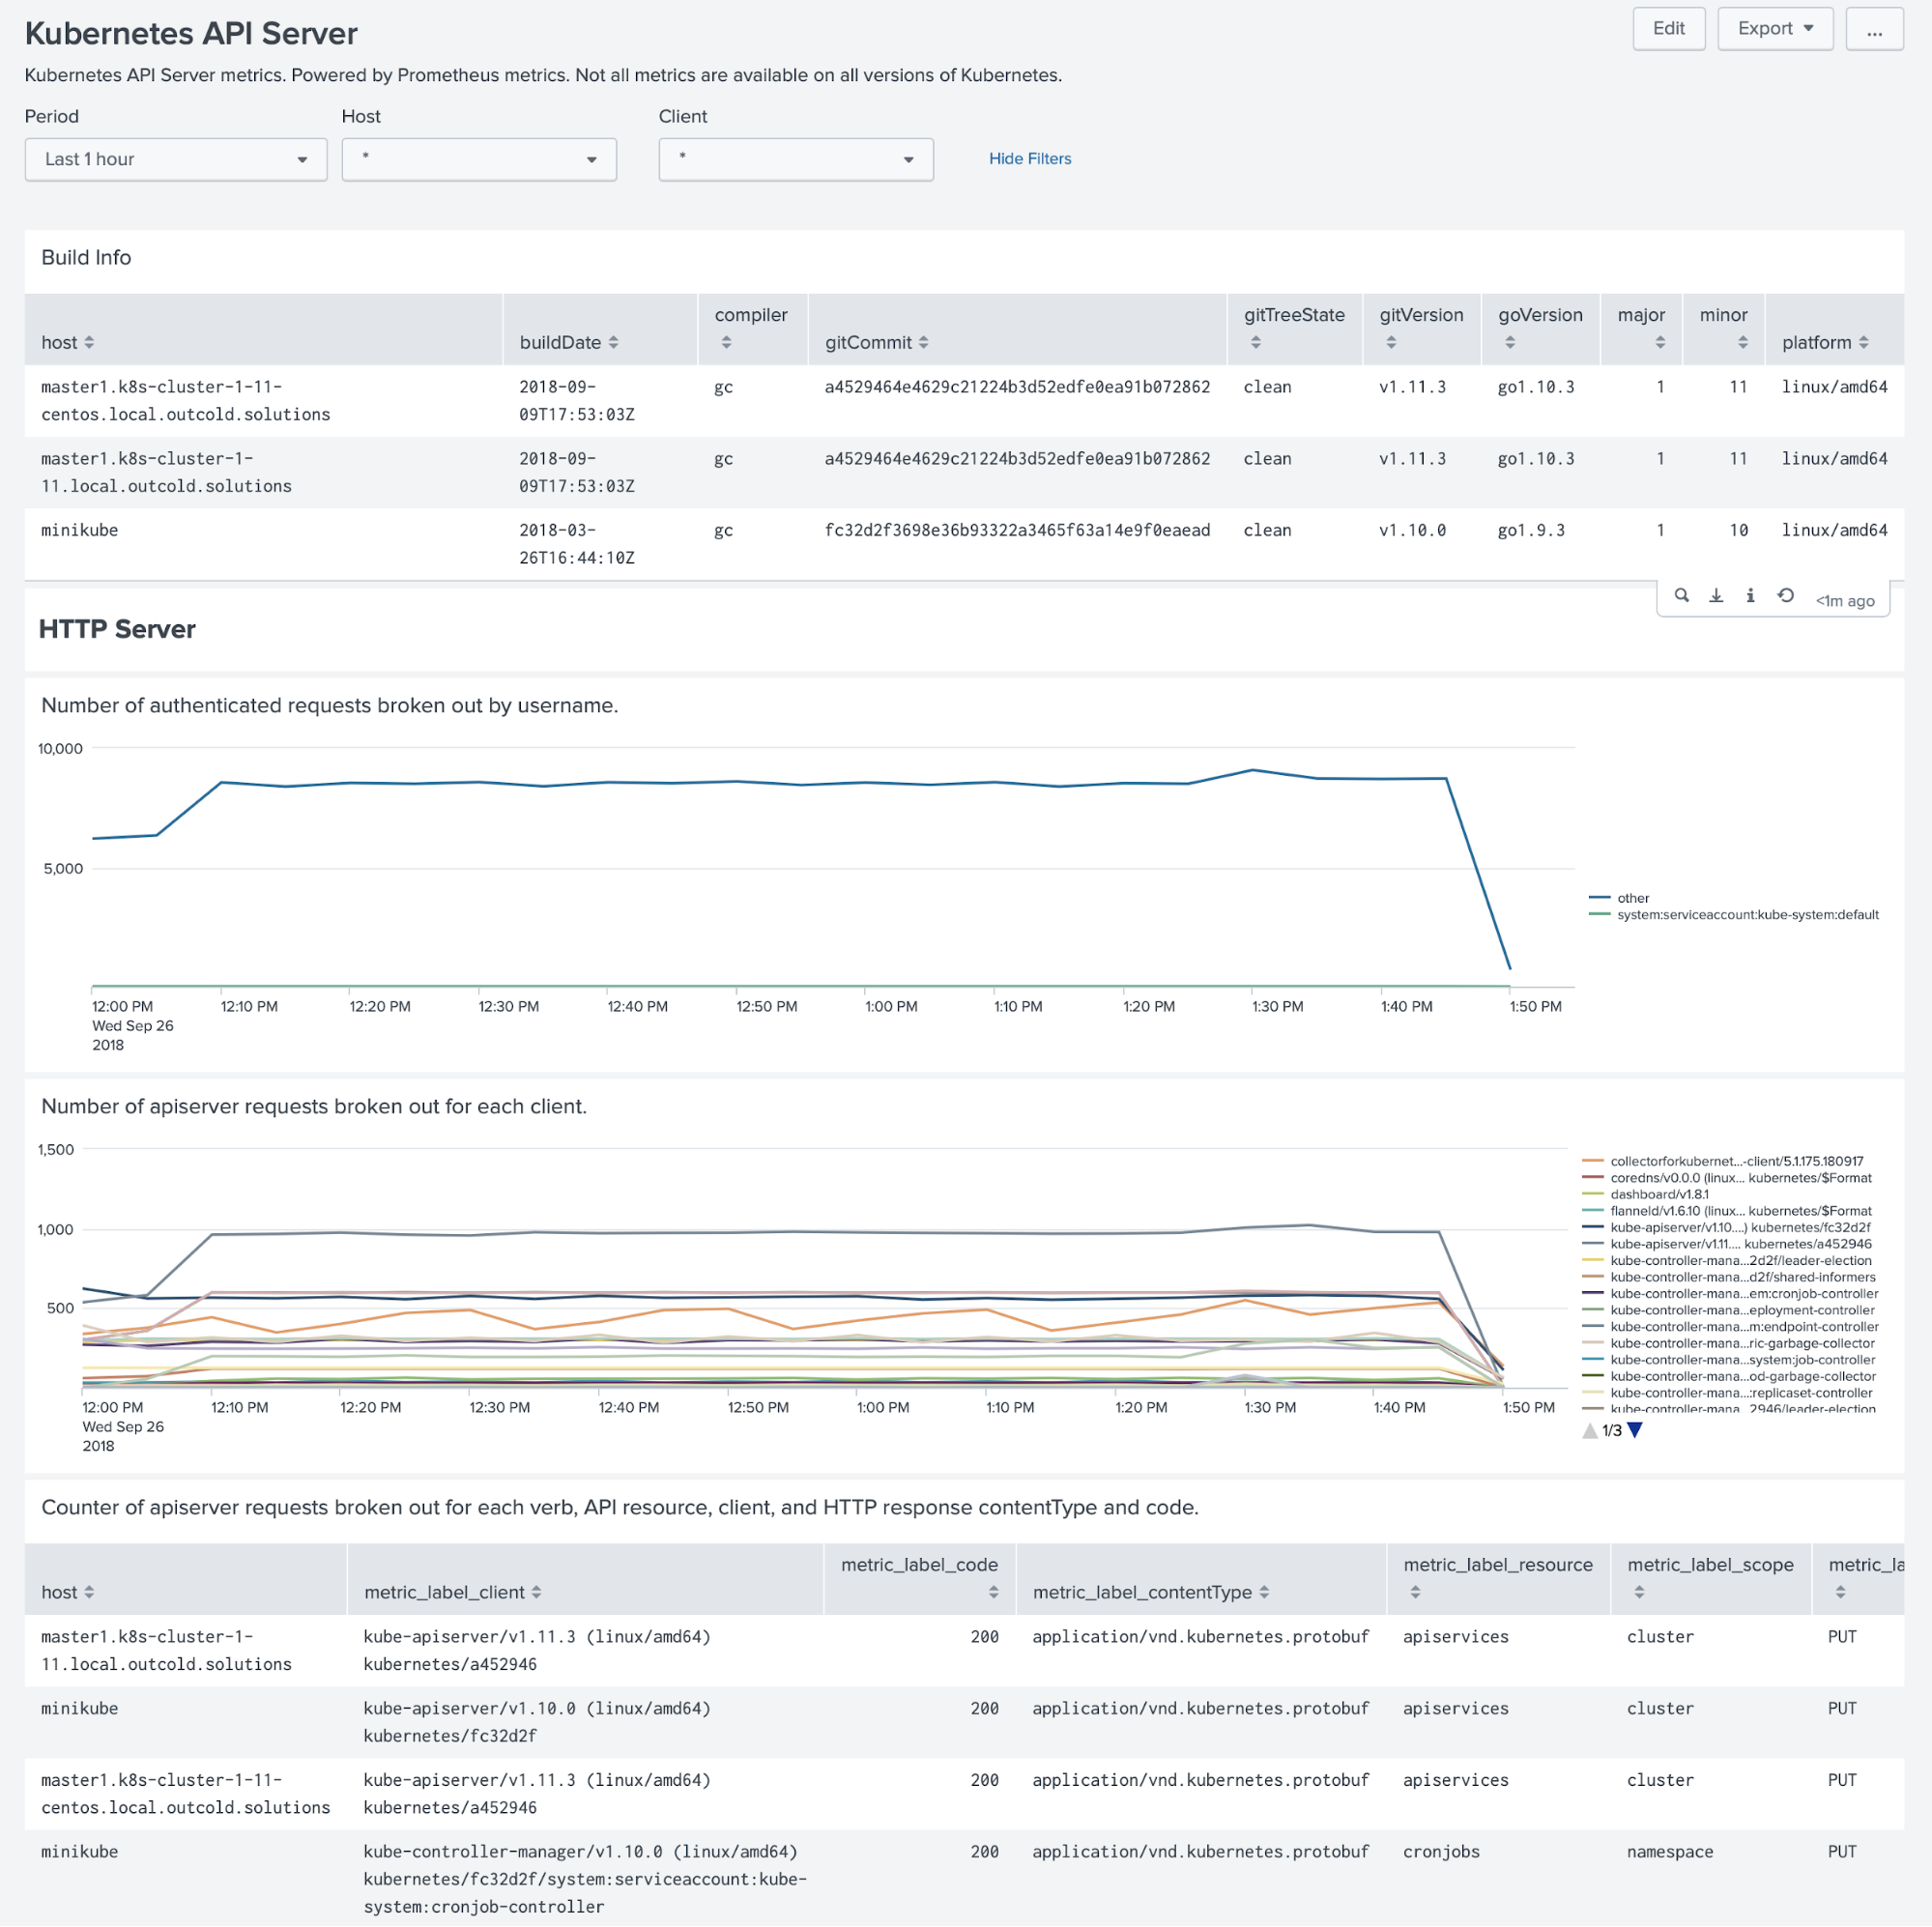
Forwarding Prometheus metrics from Control Plane and Pods. Review health of the cluster with pre-built dashboards for main Control Plane components, including kubelets, etcd clusters, API Servers and Controllers.
Review network activities, happening inside your cluster, and outside connections.

With annotations define field extractions, multi-line event patterns, hide sensitive information, discover application logs, specify target index, source or sourcetype, and more.
We provide solutions for monitoring Kubernetes, OpenShift and Docker clusters in Splunk Enterprise and Splunk Cloud. With 10 minutes setup, you will get a monitoring solution, that includes log aggregation, performance and system metrics, metrics from the control plane and application metrics, a dashboard for reviewing network activity, and alerts to notify you about cluster or application performance issues. All our solutions are powered by the Collectord, a container-native software built by Outcold Solutions that provides capabilities for discovering, transforming and forwarding logs, collecting system metrics, collecting metrics from the control plane of the orchestration frameworks and forwarding network activity. Collectord provides flexible and powerful tools for transforming logs. With our software you can hide sensitive information from the loglines before forwarding them. With Collectord you can reduce the licensing costs associated with logging aggregation by choosing which data you want to forward from the log streams. Collectord forwards container logs, host logs and can discover logs written by the containerized applications.